my #airrohr - a solar powered fine dust sensor
I have already adressed the topic of fine dust in this blog several times. But since the #Dieselgate debate, air quality is not just a topic for New Year's Eve. So I was excited by the project Luftdaten.info, which was created in the Code for Germany Context in Stuttgart. The aim of the project is to build fine dust sensors from inexpensive components. Citizens can thus build their own sensors and form a large measuring network.
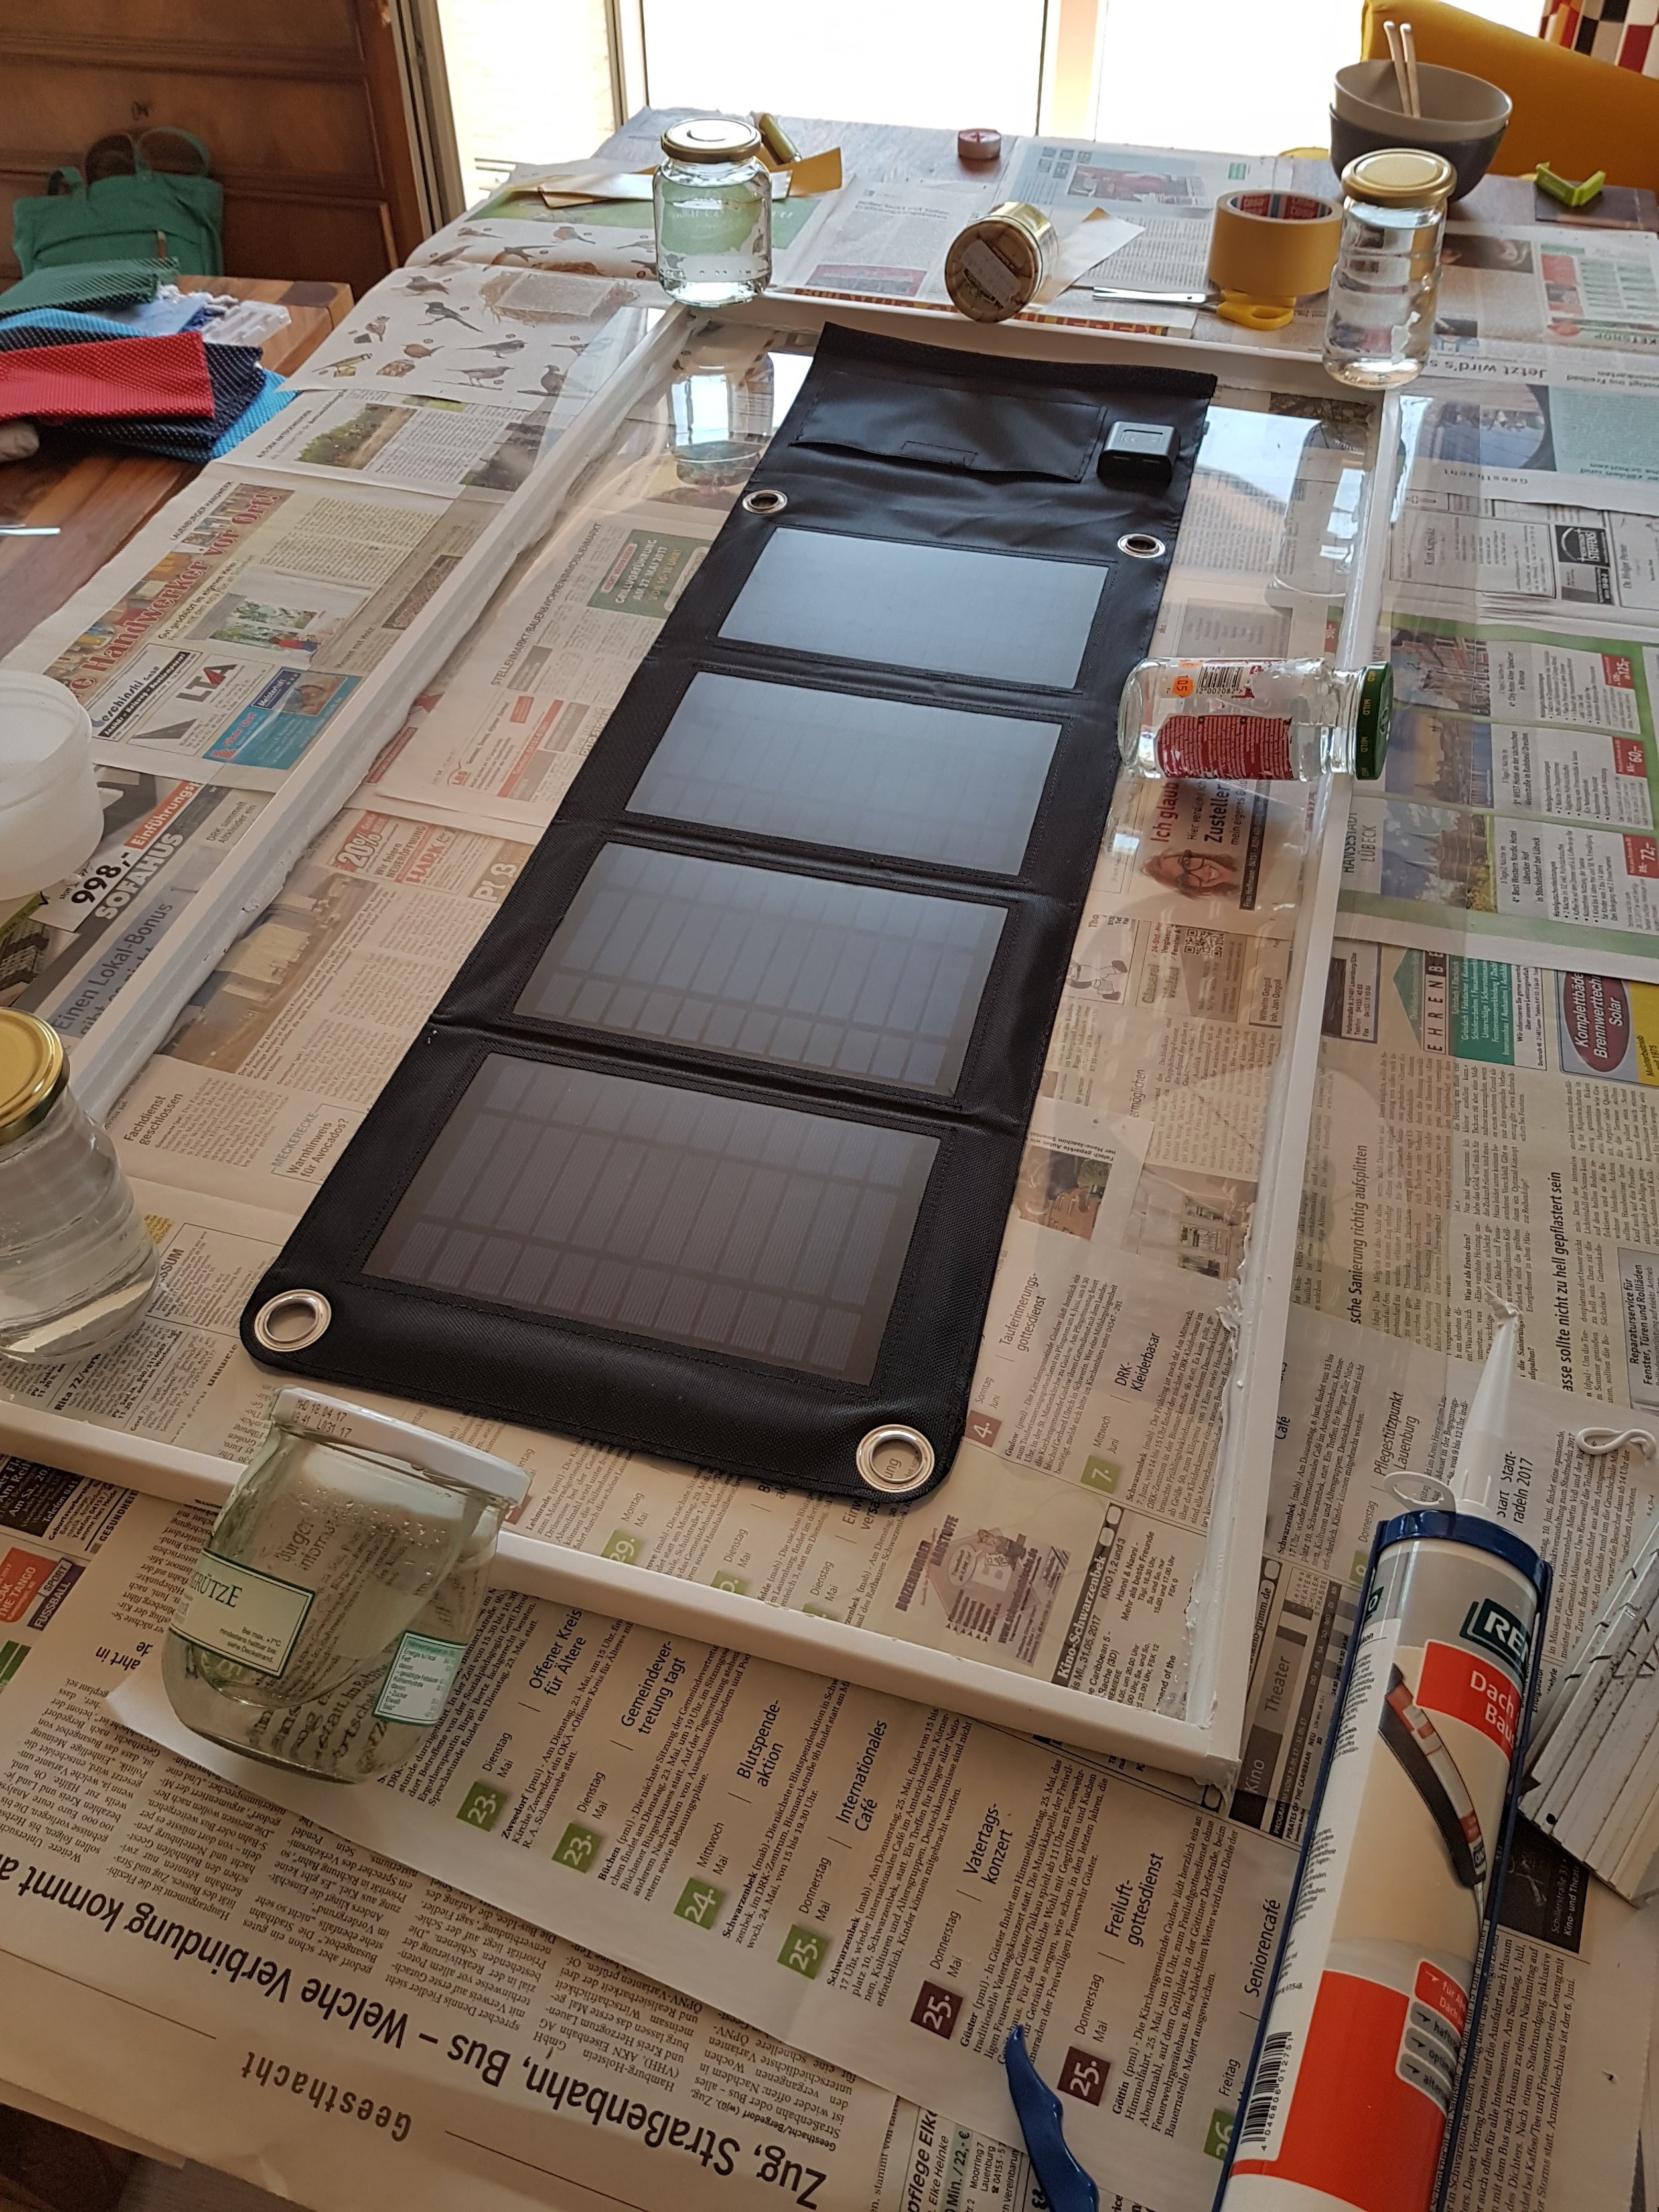
It's based on a NodeMCU ESP8266, CPU / WLAN chip and an SDS011 fine dust sensor connected to it. The kit is supplemented by a DHT22 for the measurement of temperature & humidity. Detailed instructions including the (open-sourced) firmware can be found on the project website.

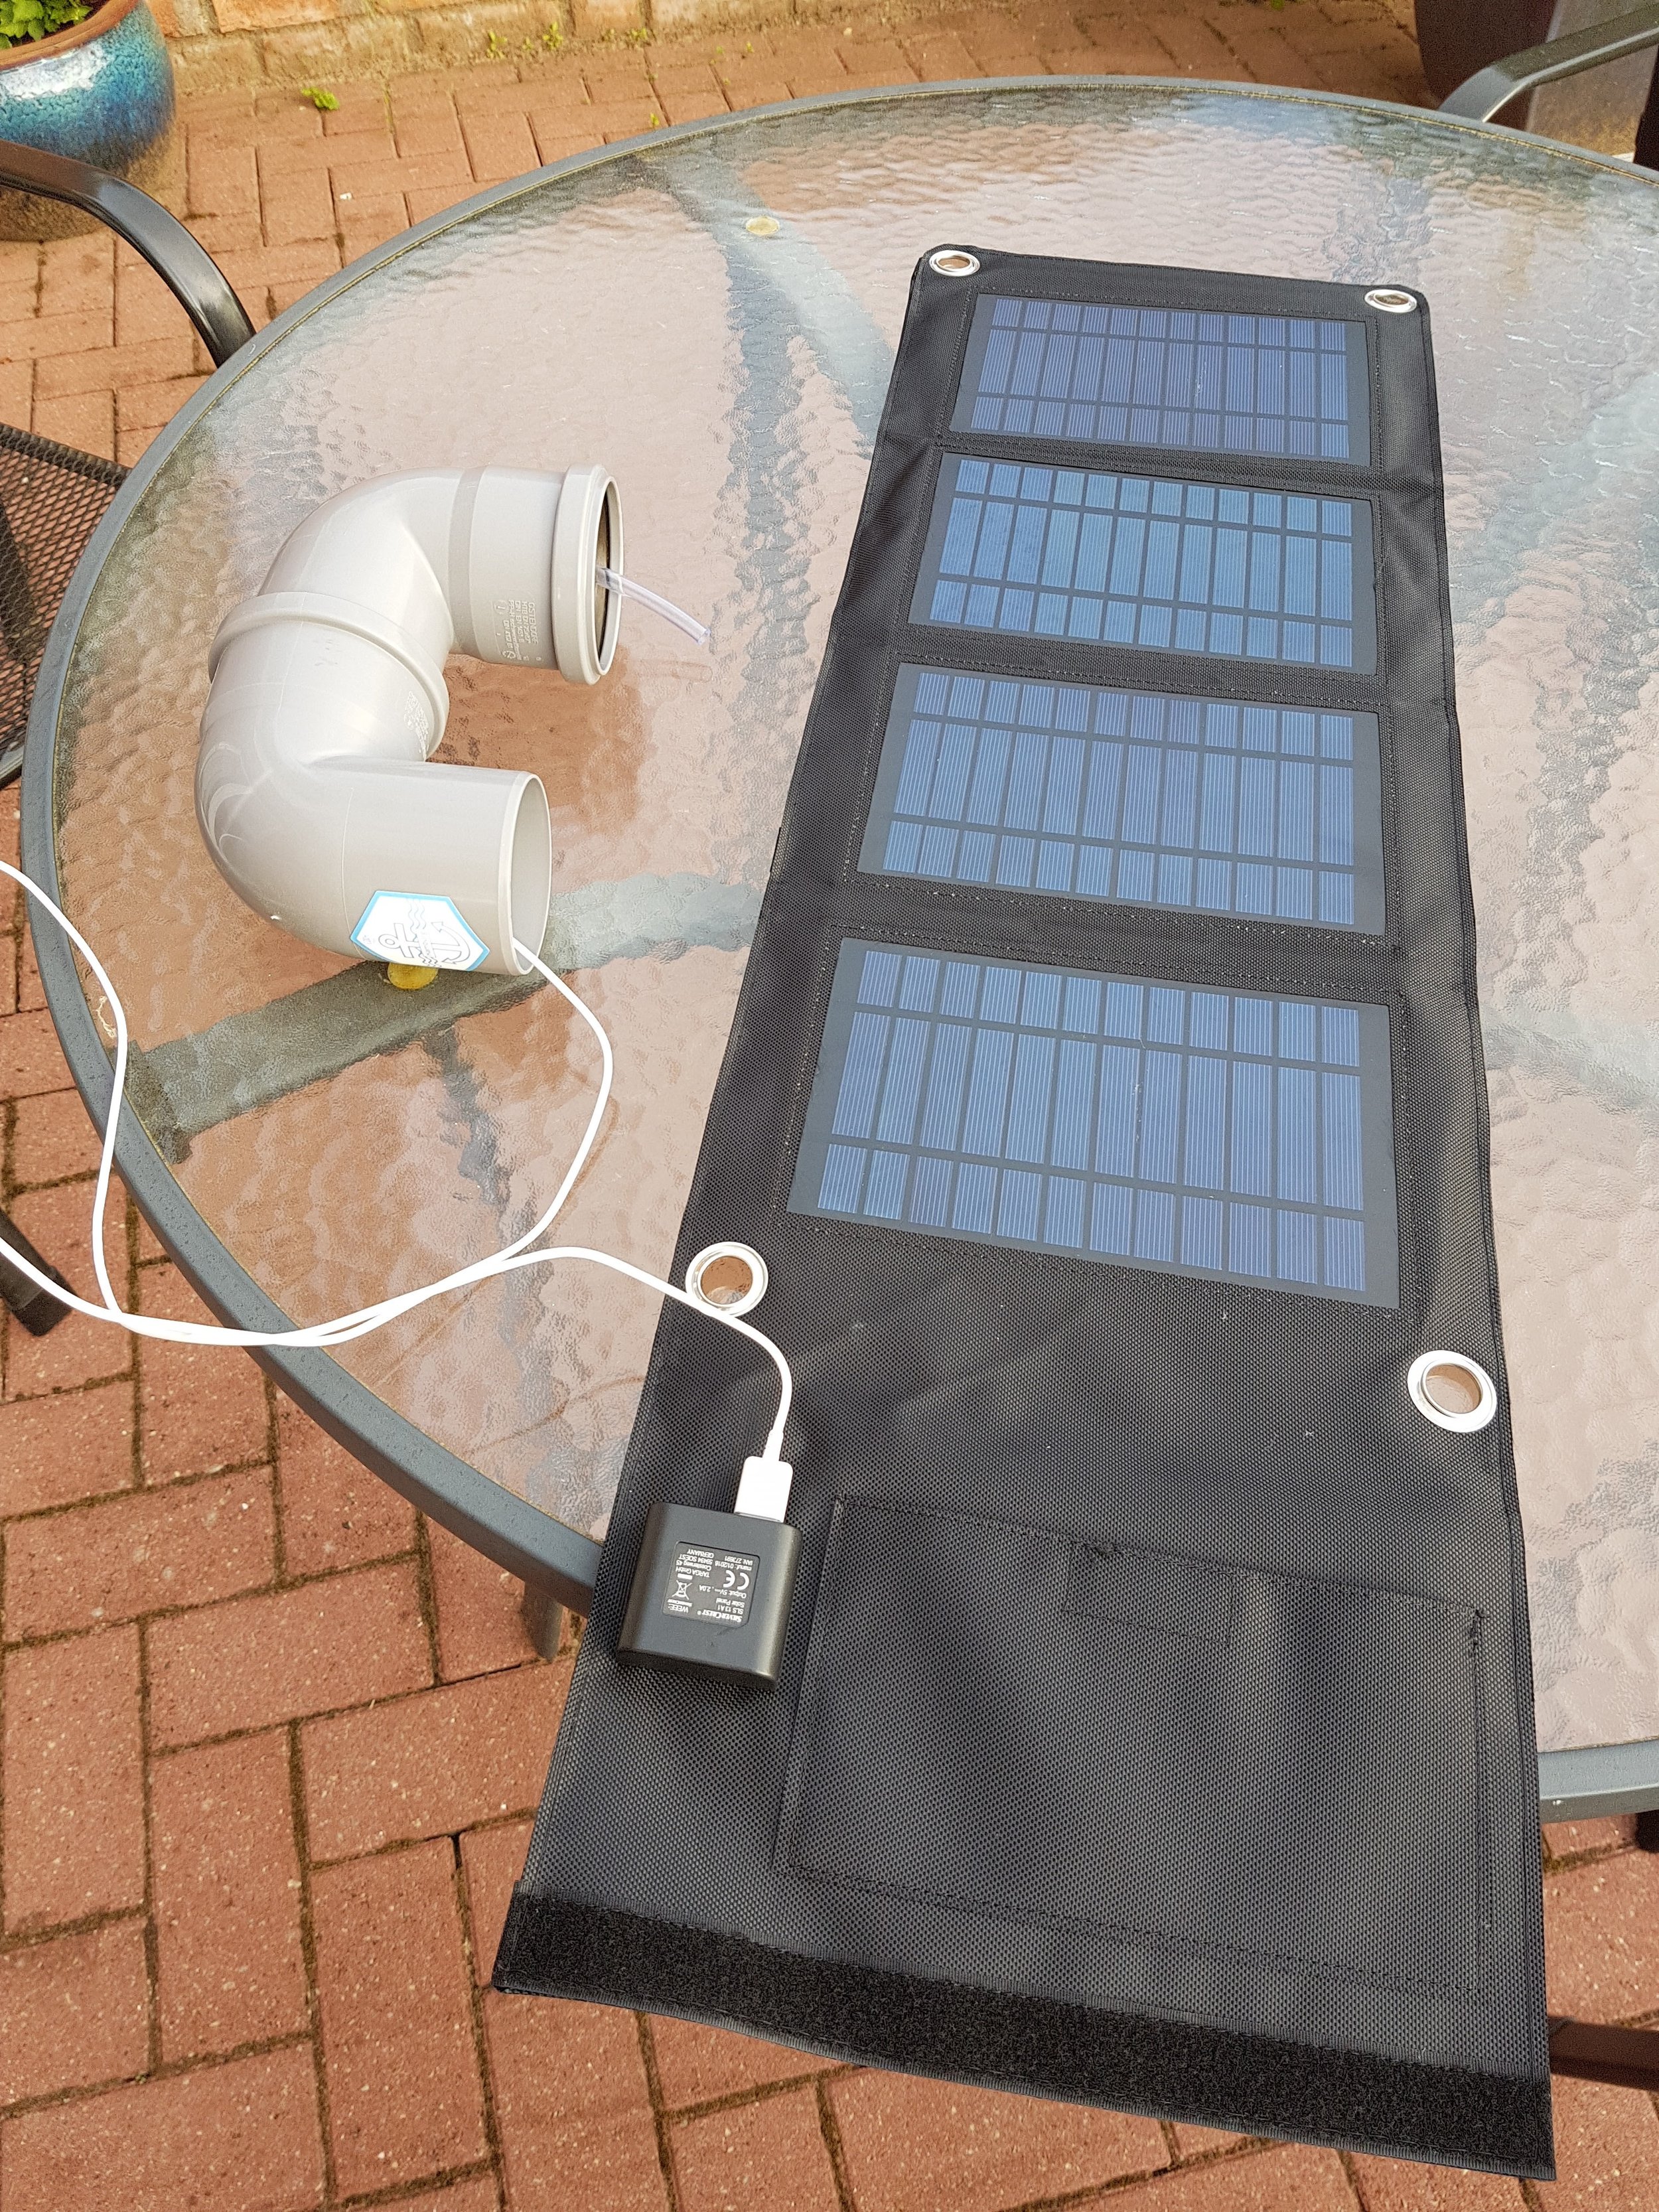
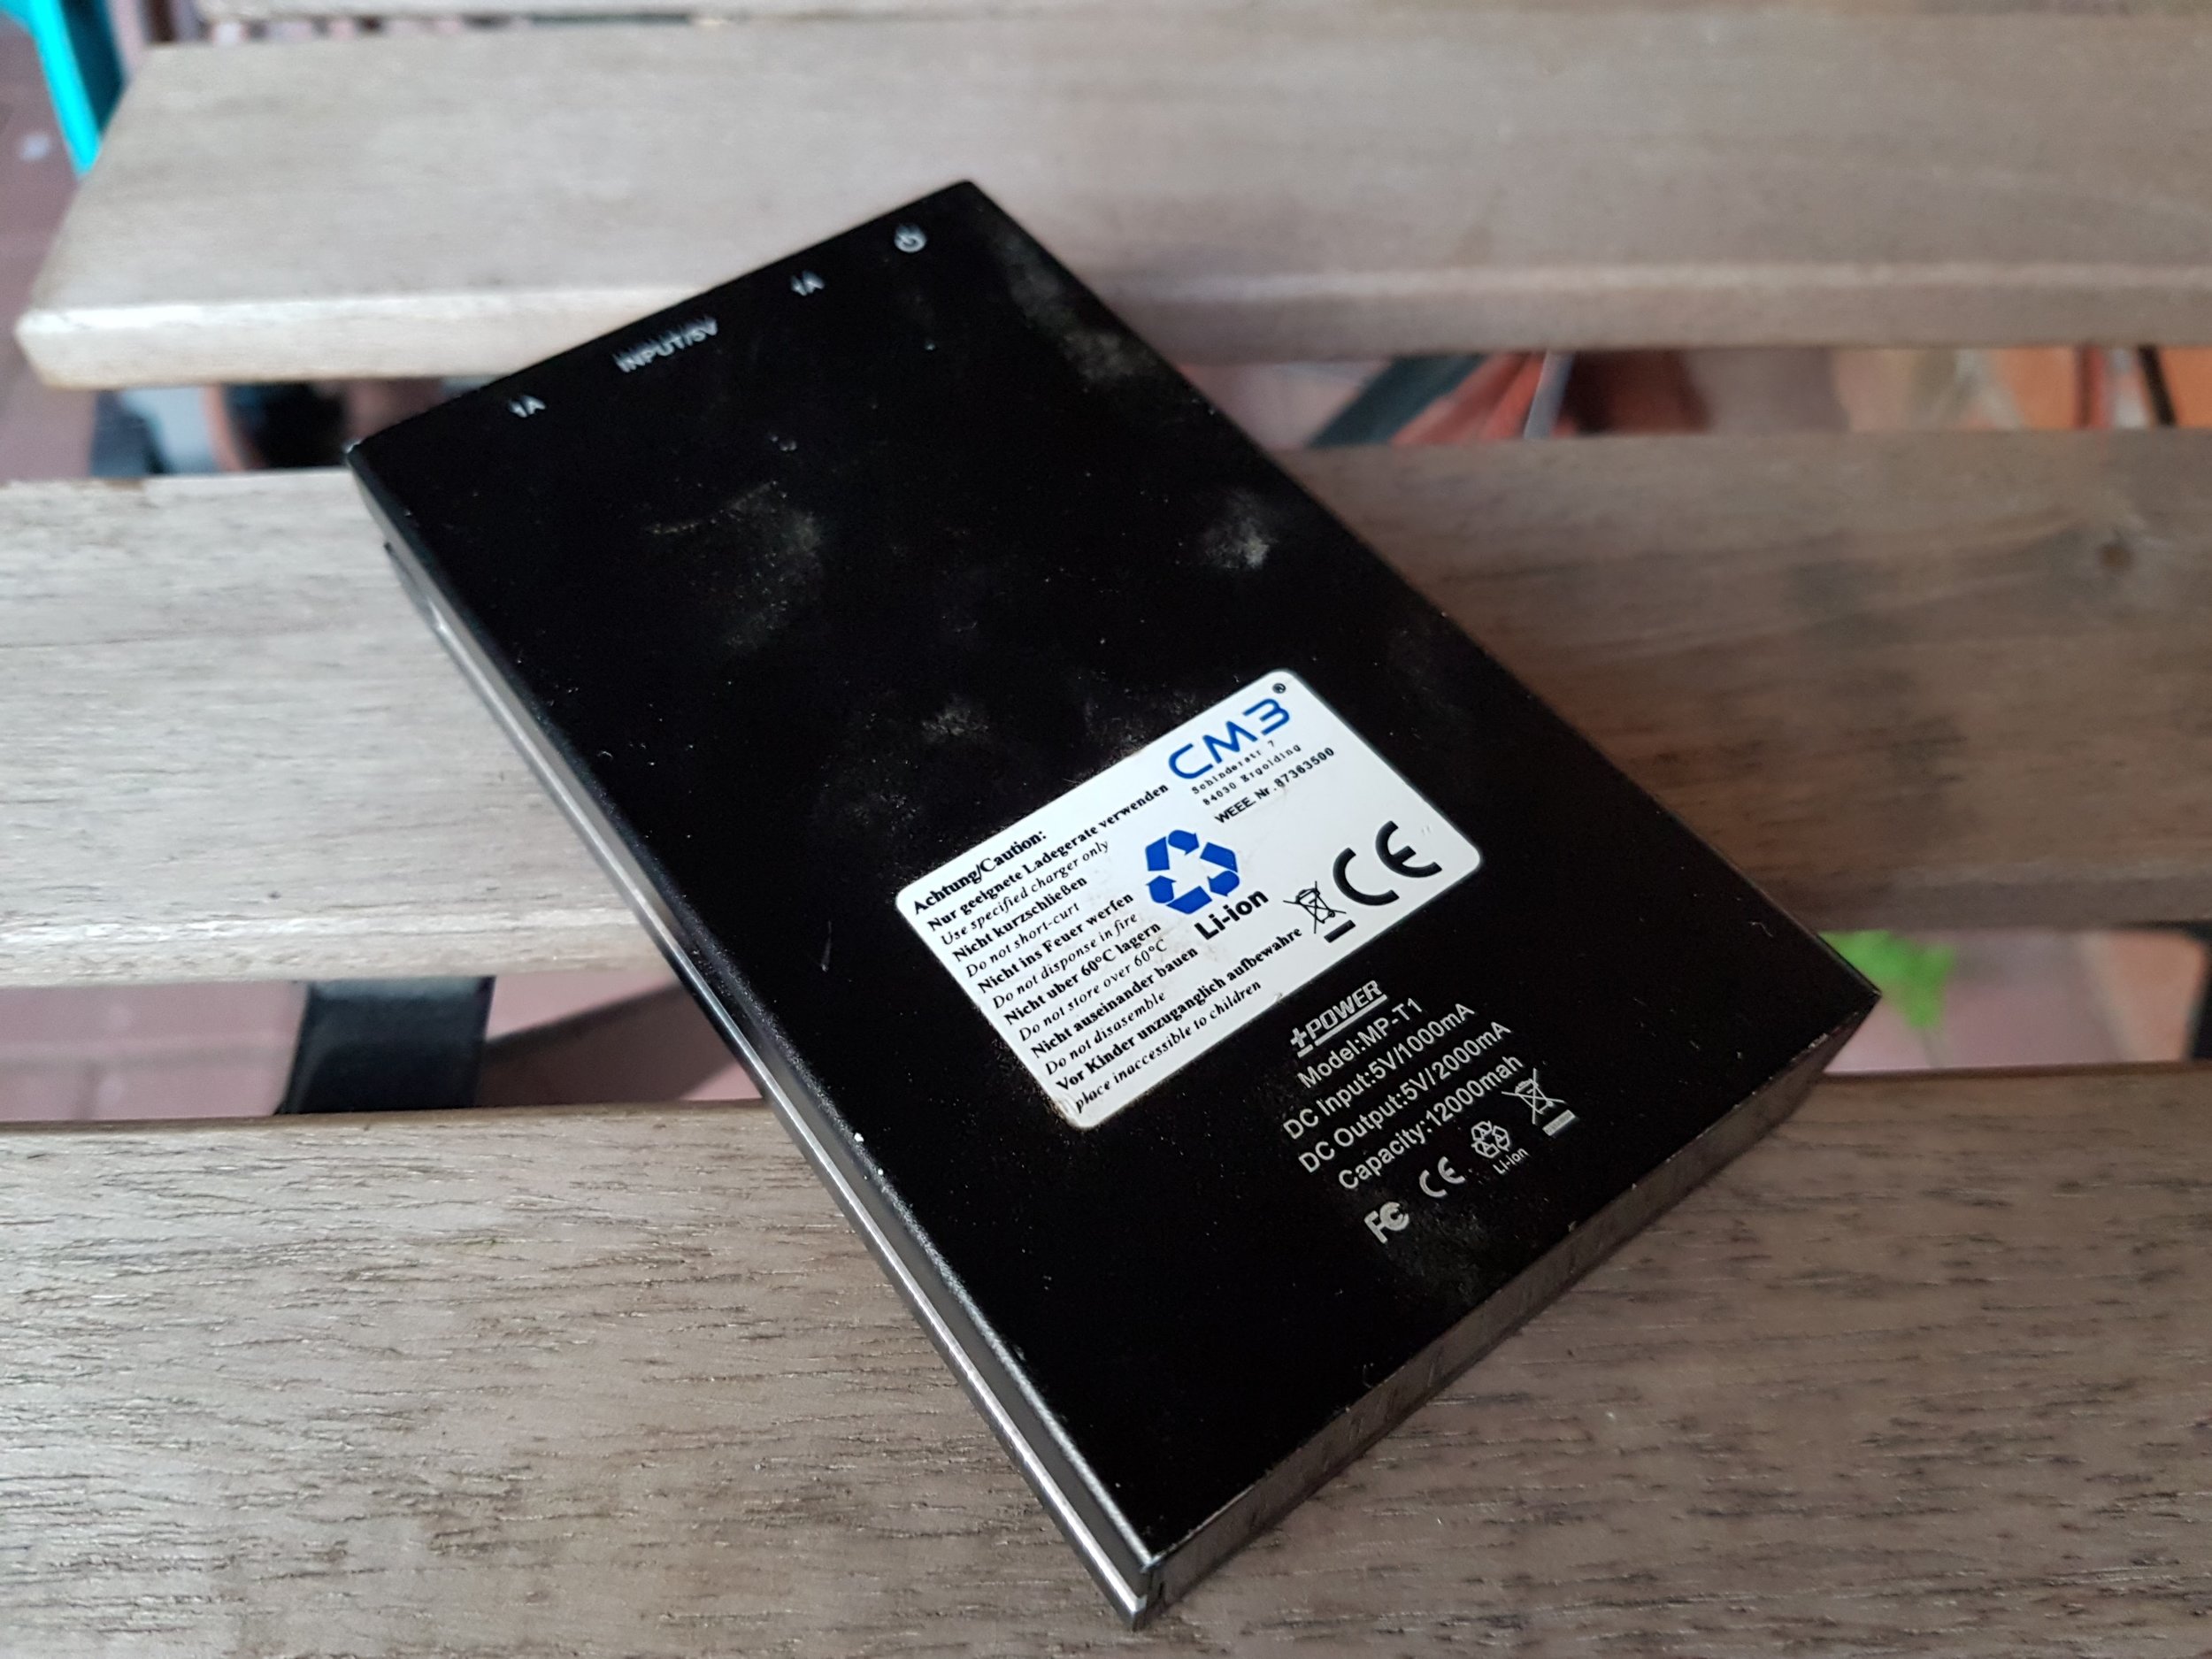
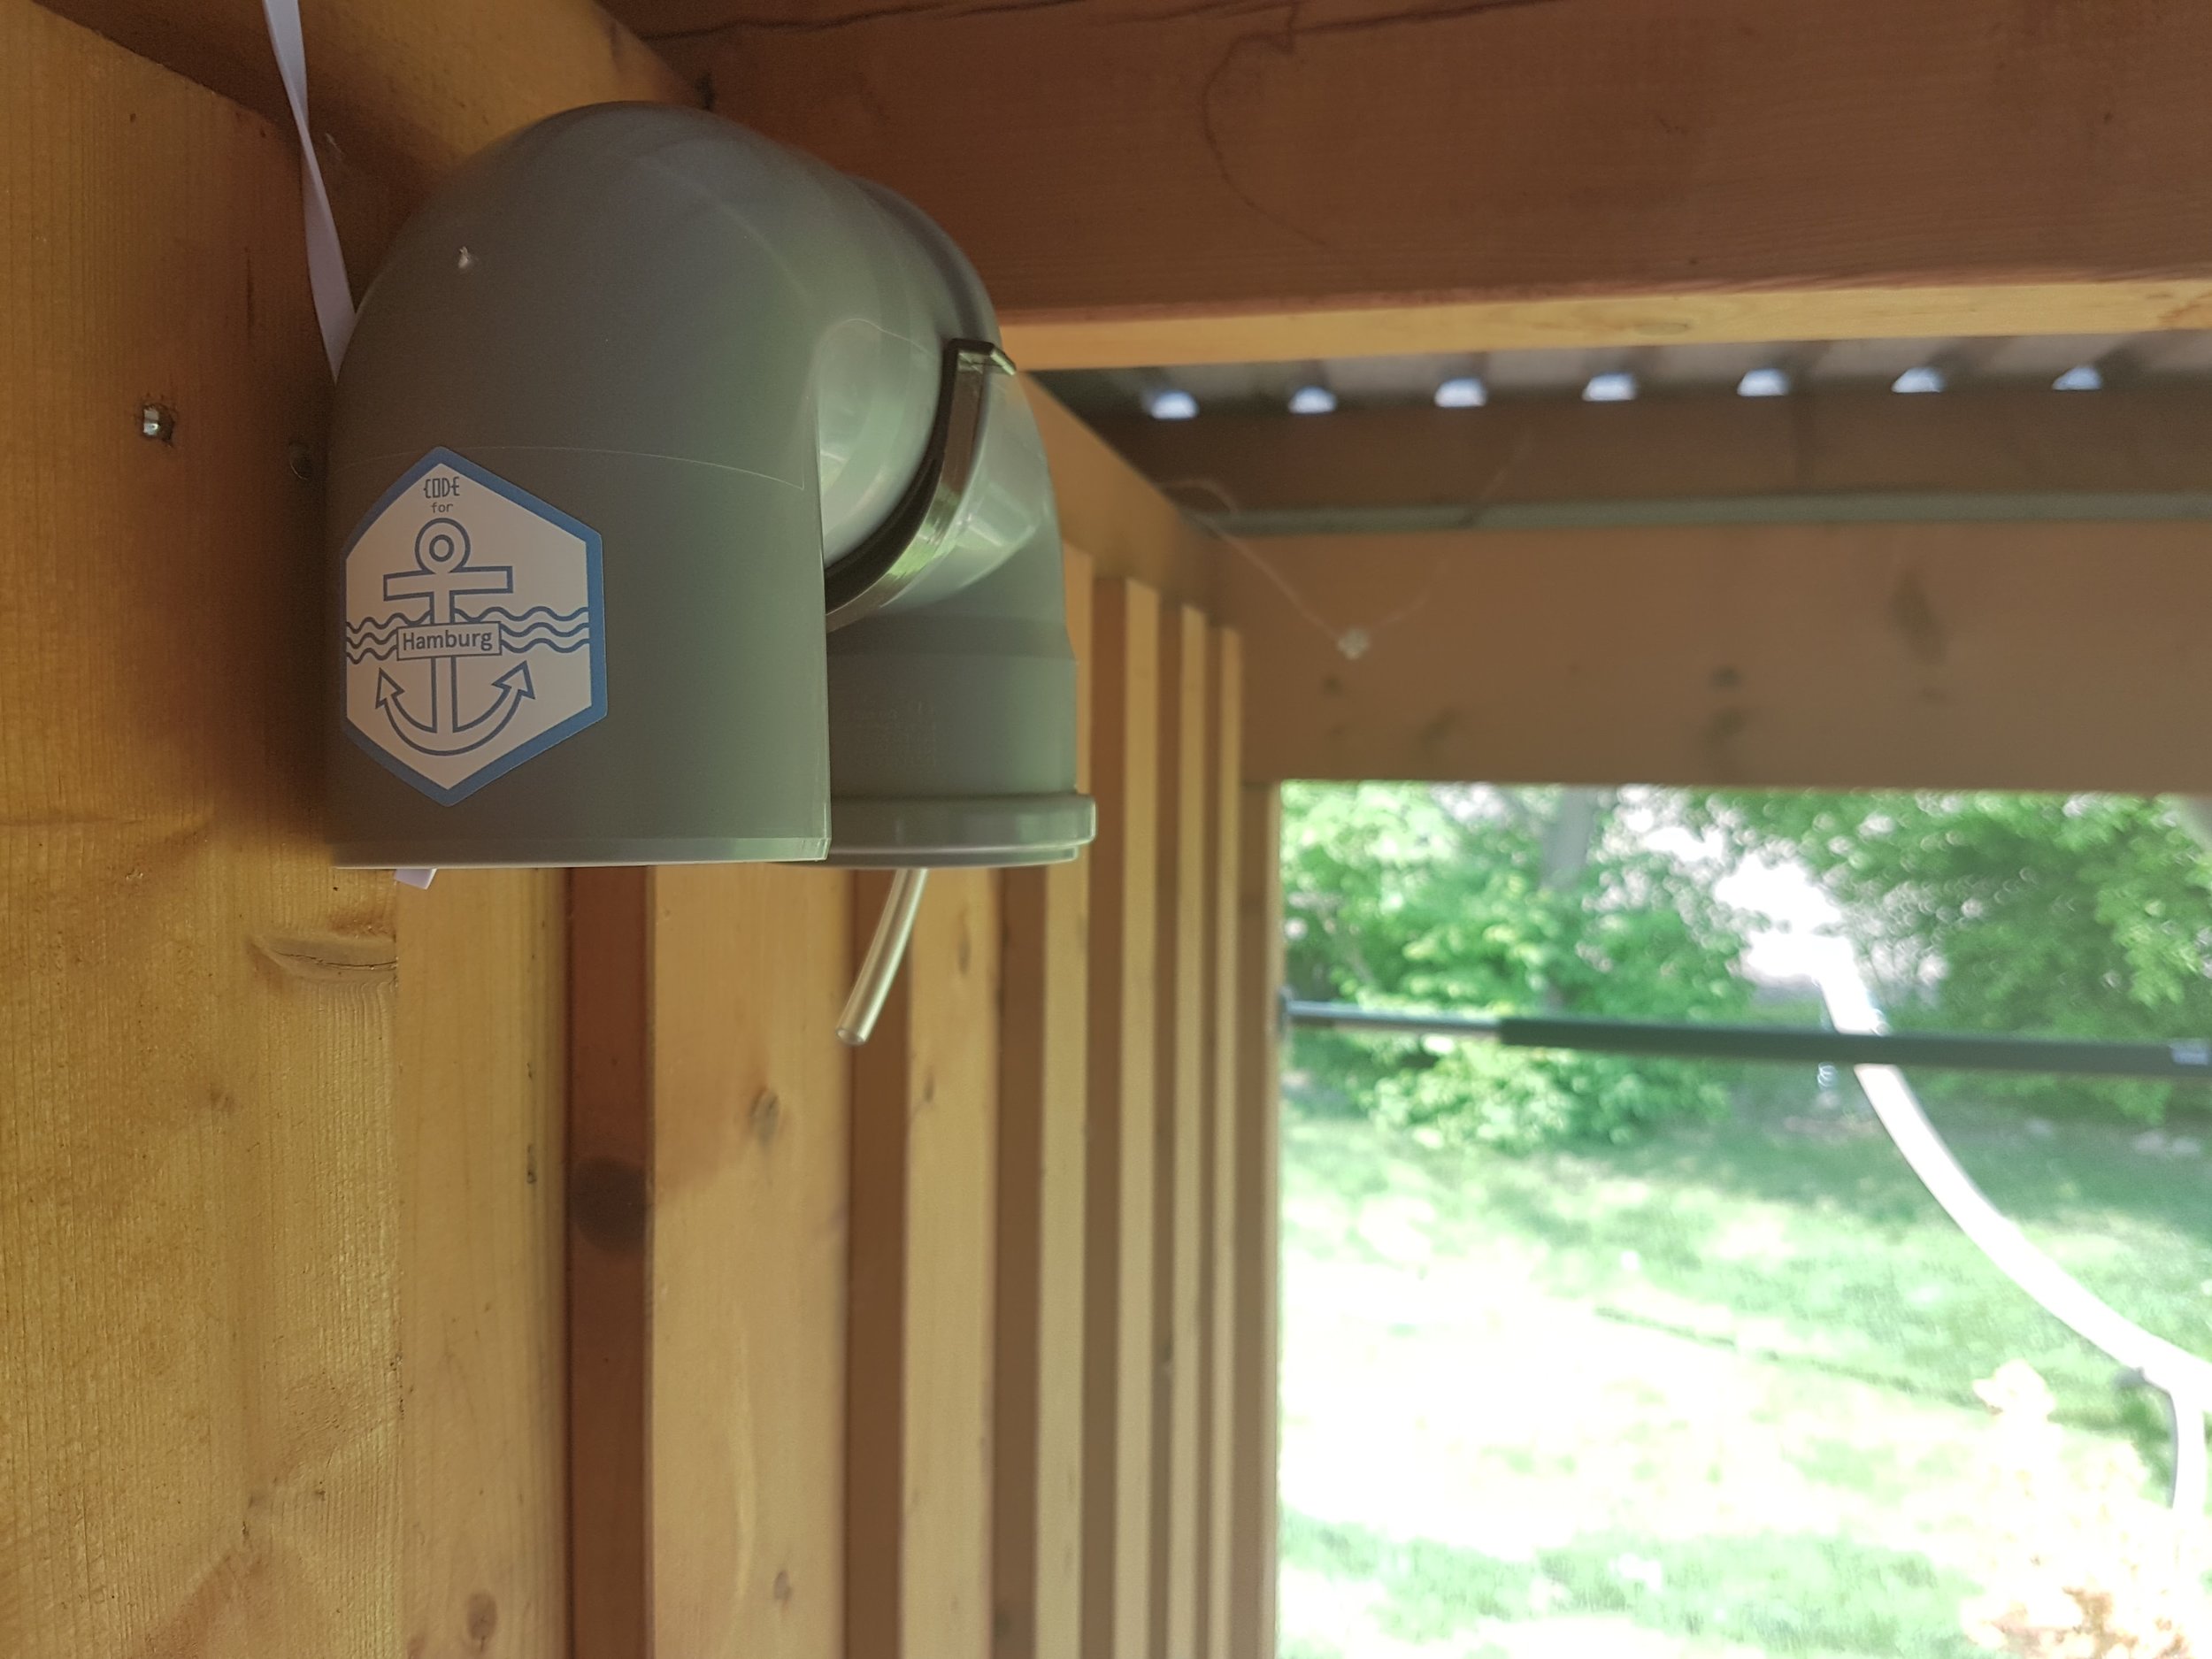
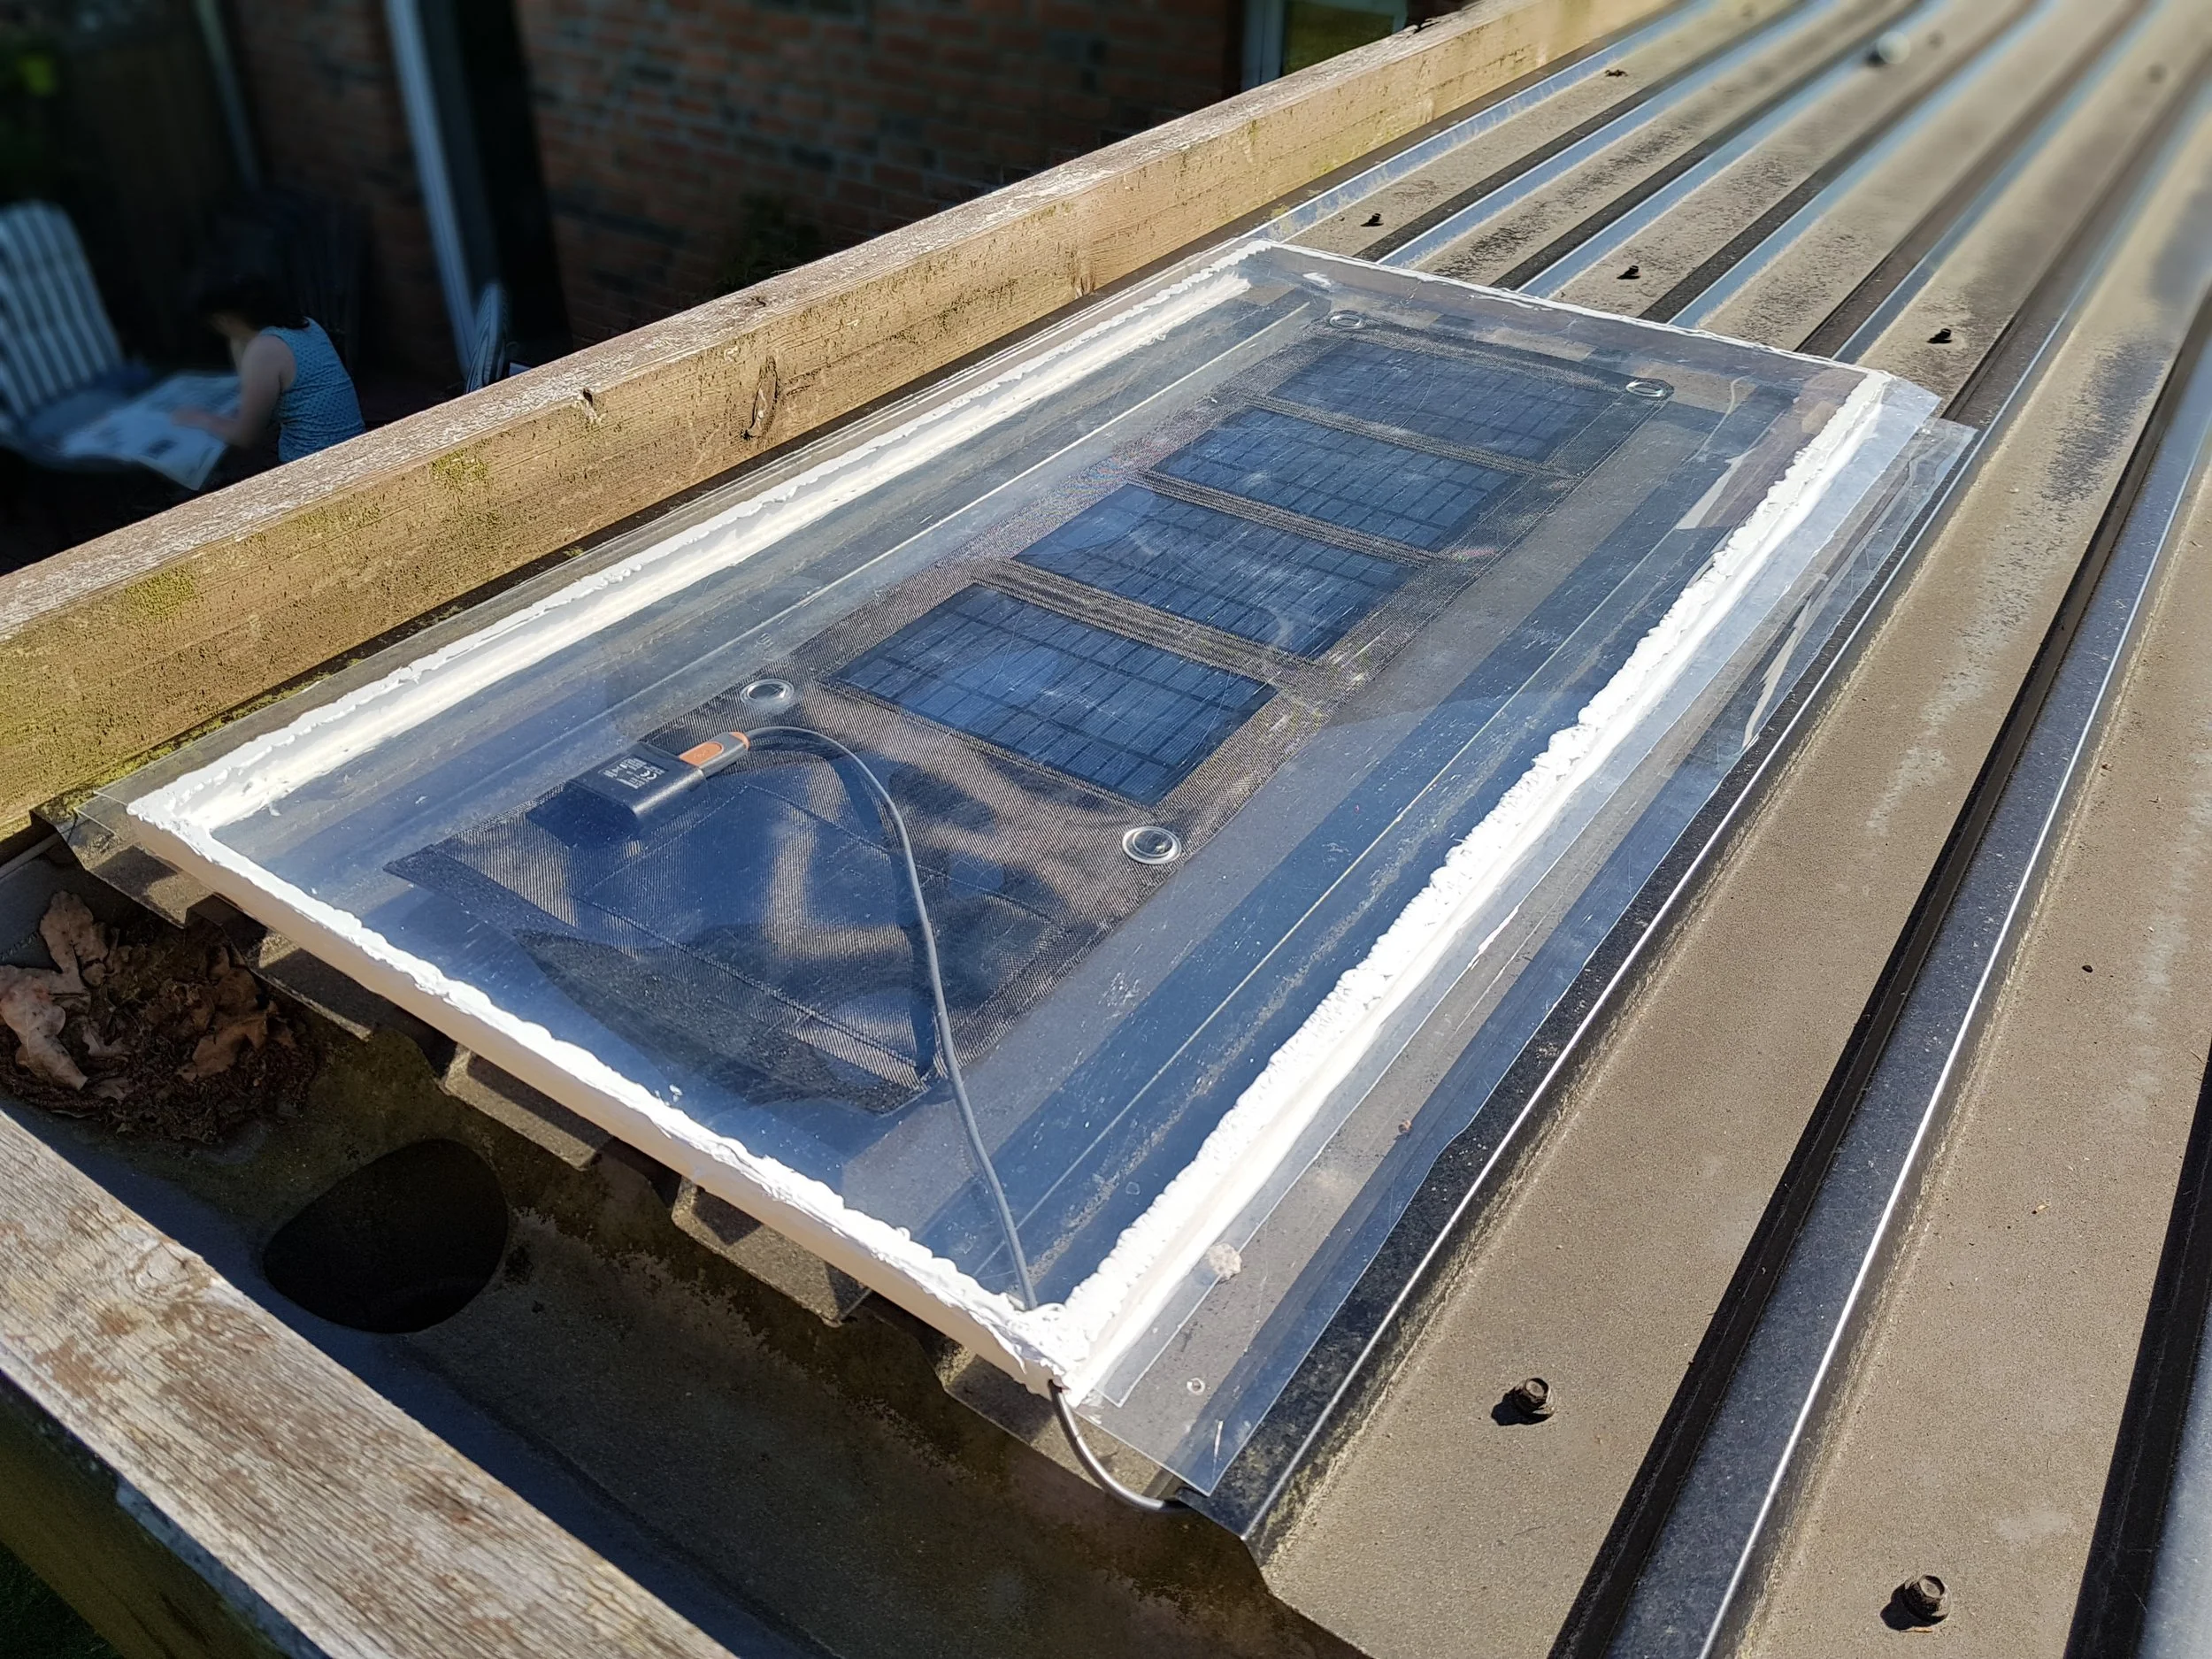
During the assembly of the sensor I had the idea to operate it using solar cells or a small wind turbine. I went for for a relatively cheap 14 Watt Lidl solar cell solution with a connected 12.000 mAh buffer battery. Some first tests with the sensor connected to the solar cell with direct sun exposure showed the sensor to be performing quite well. The cell is weather-proofed with transparent plastic and mounted on our carport. I hope the performance of the setup will be sufficient to power the sensor continuously (although I doubt it given the expected losses of the battery and attached cables).
UPDATE (26.06.2017): The sensor has been continously running on solar power for over a month now.
UPDATE (16.07.2017): First half-hour blackout of the sensor at night (following a rainy day)
The sensor data is accessible via the sensor's URL, but is also published to the central server of Luftdaten.info, where it can be viewed on a map. Detailed data for each active sensor is available on a separate website. A nice addition is the amazon Alexa skill, with which the currently measured value is available by voice query.
Happy New Year!
As in recent years I had a look on the fine-particle concentrations of the Hamburg air quality measurement network during the fireworks. Especially with the ongoing discussion about the Diesel scandal I guess we might want to reconsider this habit... Keep in mind that the graph shows a moving average over 24 hours so the actual concentrations were much higher.

Update: There appears to be an issue with embedding Tableau-Charts in Squarspace. You can find the interactive Version here.