my not-so revolutionary approach to energy management

Every once in a while, you encounter something that genuinely changes the way you do things.
And oddly enough, for me, that shift came in the form of a solar installation - and a little wooden box.
Let's backtrack a bit. Last November, we installed a solar photovoltaic rooftop system complete with a battery. This was our household's step towards sustainability and something that we had been wanting to do for quite some time. Being a nerd I quickly integrated the system metrics into Home Assistant to monitor everything on my phone or maybe use an old iPad on the wall as a dashboard.
But, you see, the problem was this: That would mean having yet another screen to glue my eyes to, yet another gadget to become ensnared by. I craved something a bit more tangible, more personal. I didn't want another screen; I wanted a piece of furniture, something that could seamlessly blend into my everyday life. And that's when it struck me - why not a wooden box?

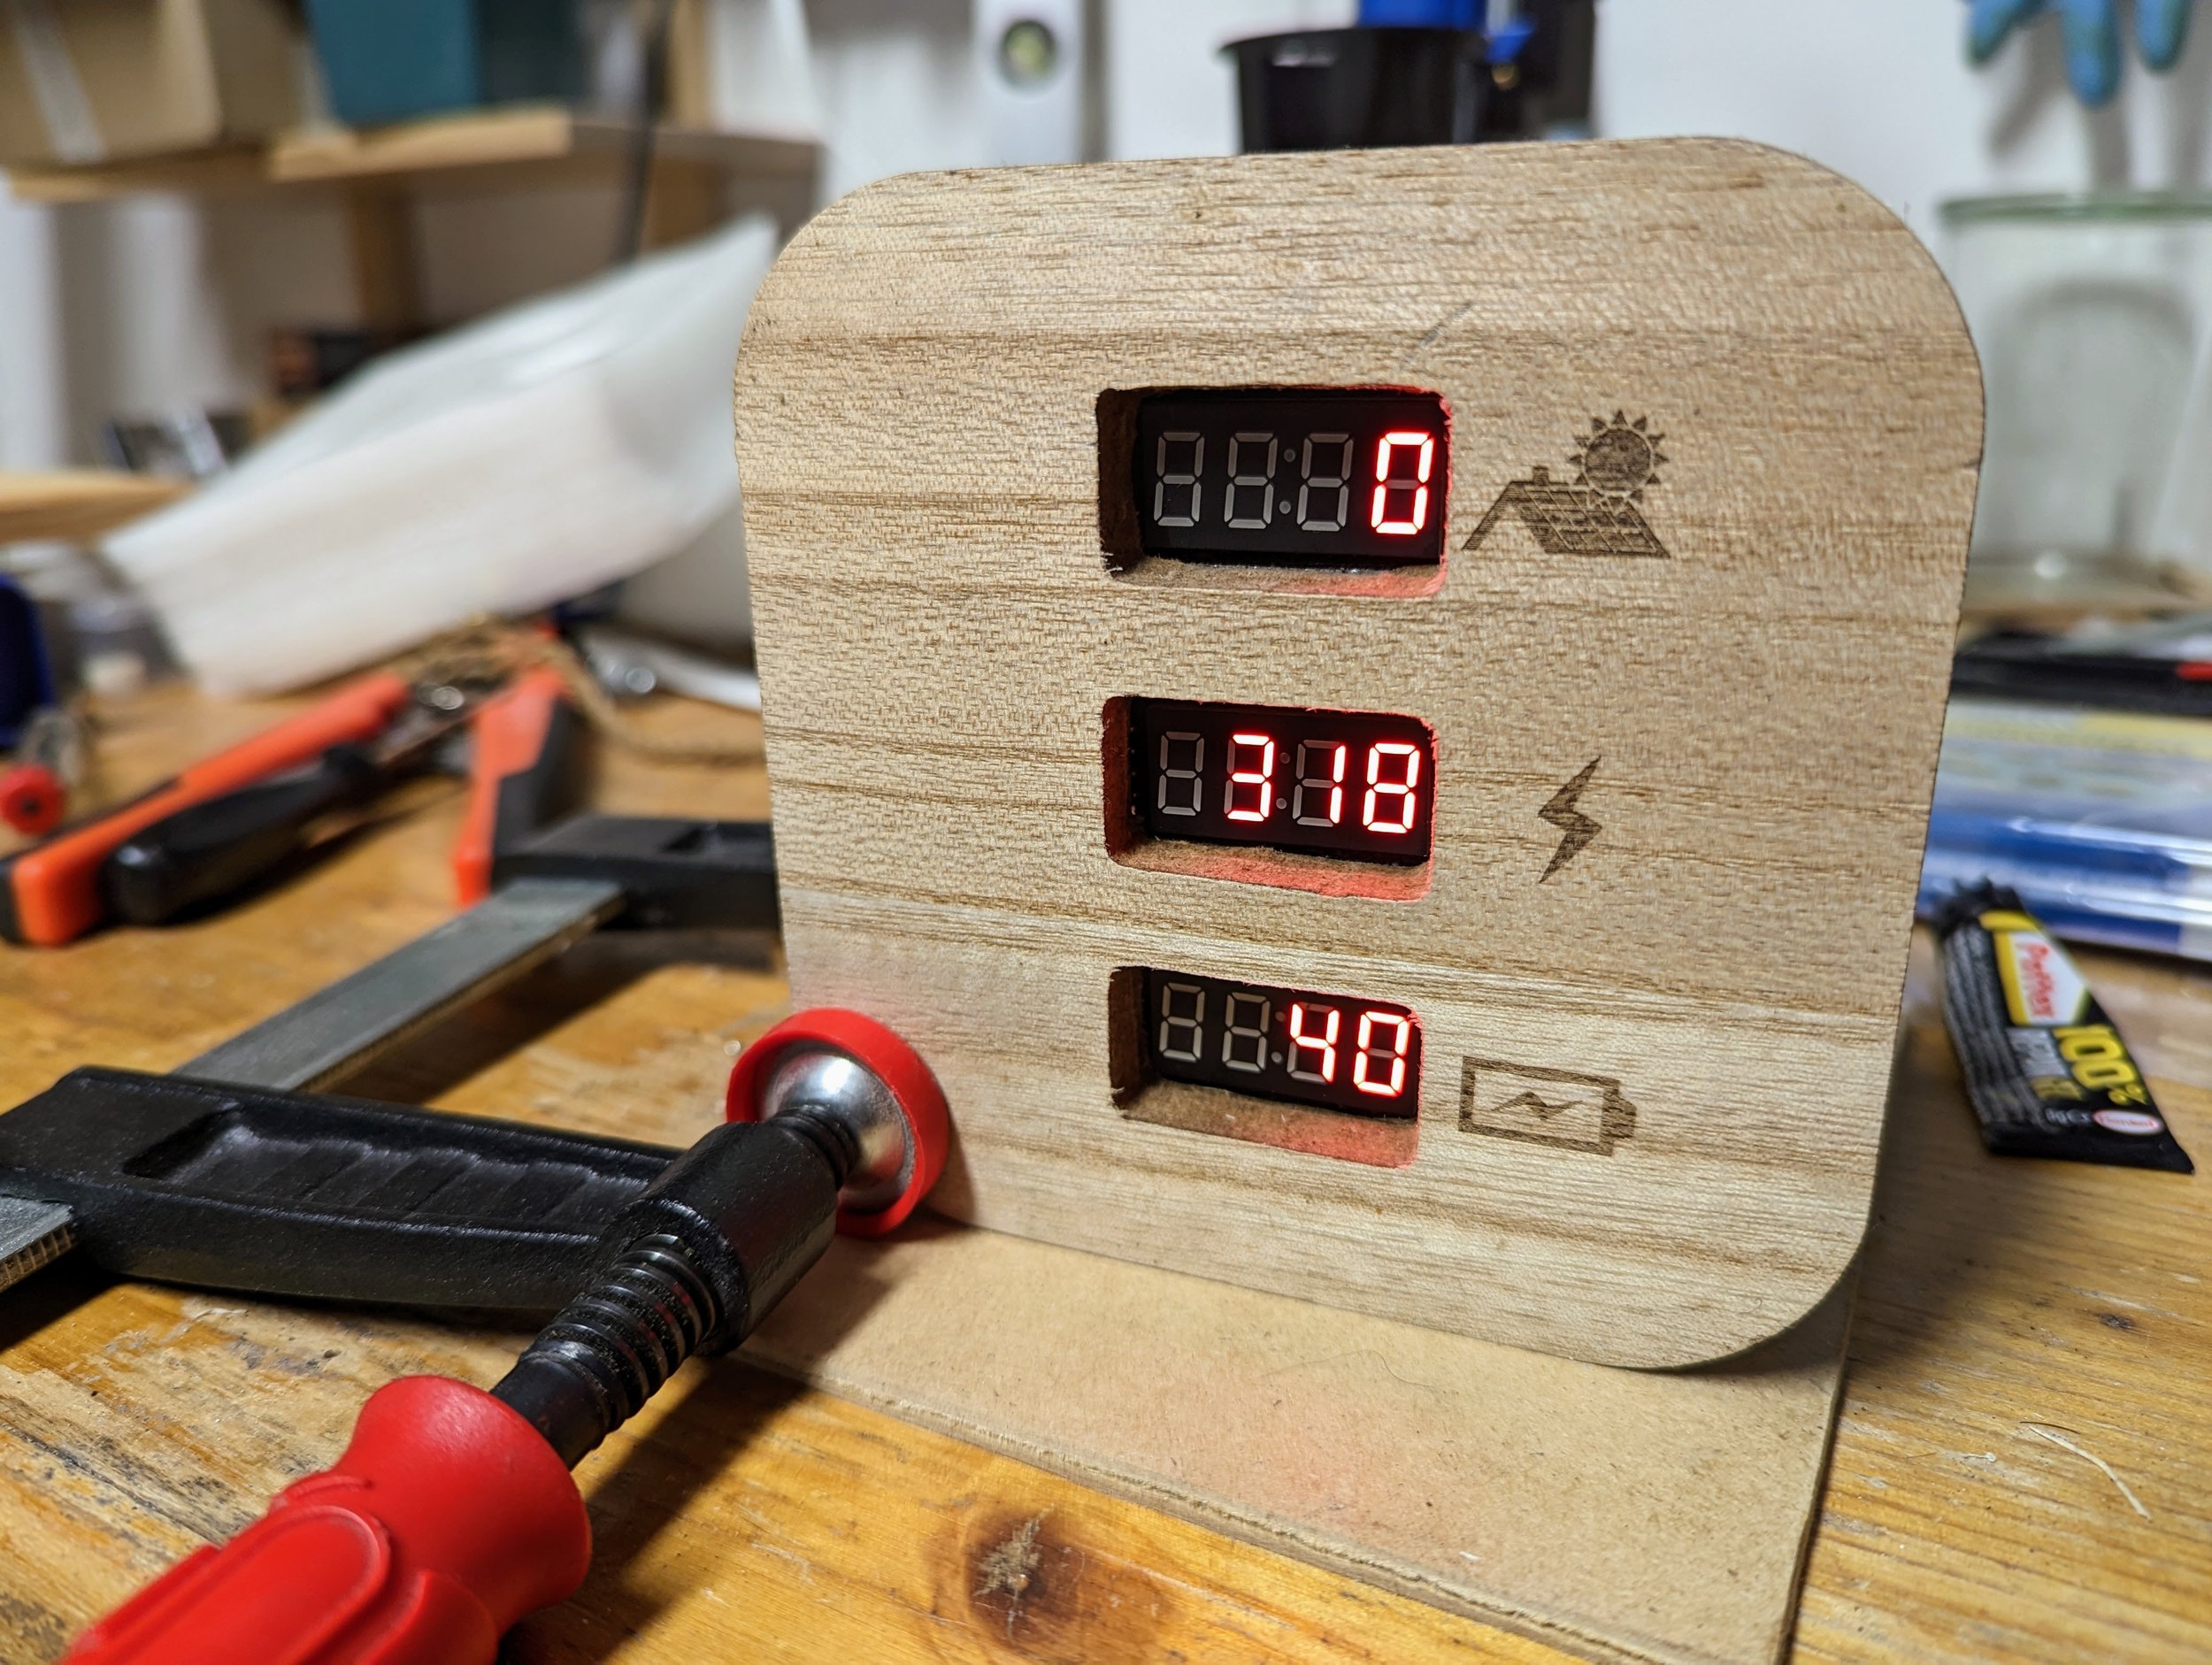
Fast forward a few weeks, I was looking at this minimalist yet charming little thing, its surface punctured with some CNC-ed holes for 7-segment LEDs and some laser-engraved icons. Inside it was a Raspberry Pi Pico W, powering the thing, and an air temperature and humidity sensor thrown in for good measure.
As soon as I placed it in my living room, the transformation was immediate and astounding. This humble box changed my daily routine. No longer did I have to constantly check my phone or wonder about our home's energy consumption. A quick glance at the box was enough to answer questions like, "Do we have enough power to start the dishwasher, or should I wait for another 15 minutes?"
The box has become a real-time, tactile energy meter. It’s subtly notifying me if something in the house is consuming more energy than usual. "Hmm, the LED's showing an increase. Did I leave some appliance on?" It’s just that simple and that effective. What really made this little box special is its character. It isn't just another piece of cold, impersonal tech. It is fun to look at, distinctly retro and above all a real energy saver.
Why Adobe Photoshop’s New Generative Fill Feature might be a Game Changer for Urban Design and Public Participation
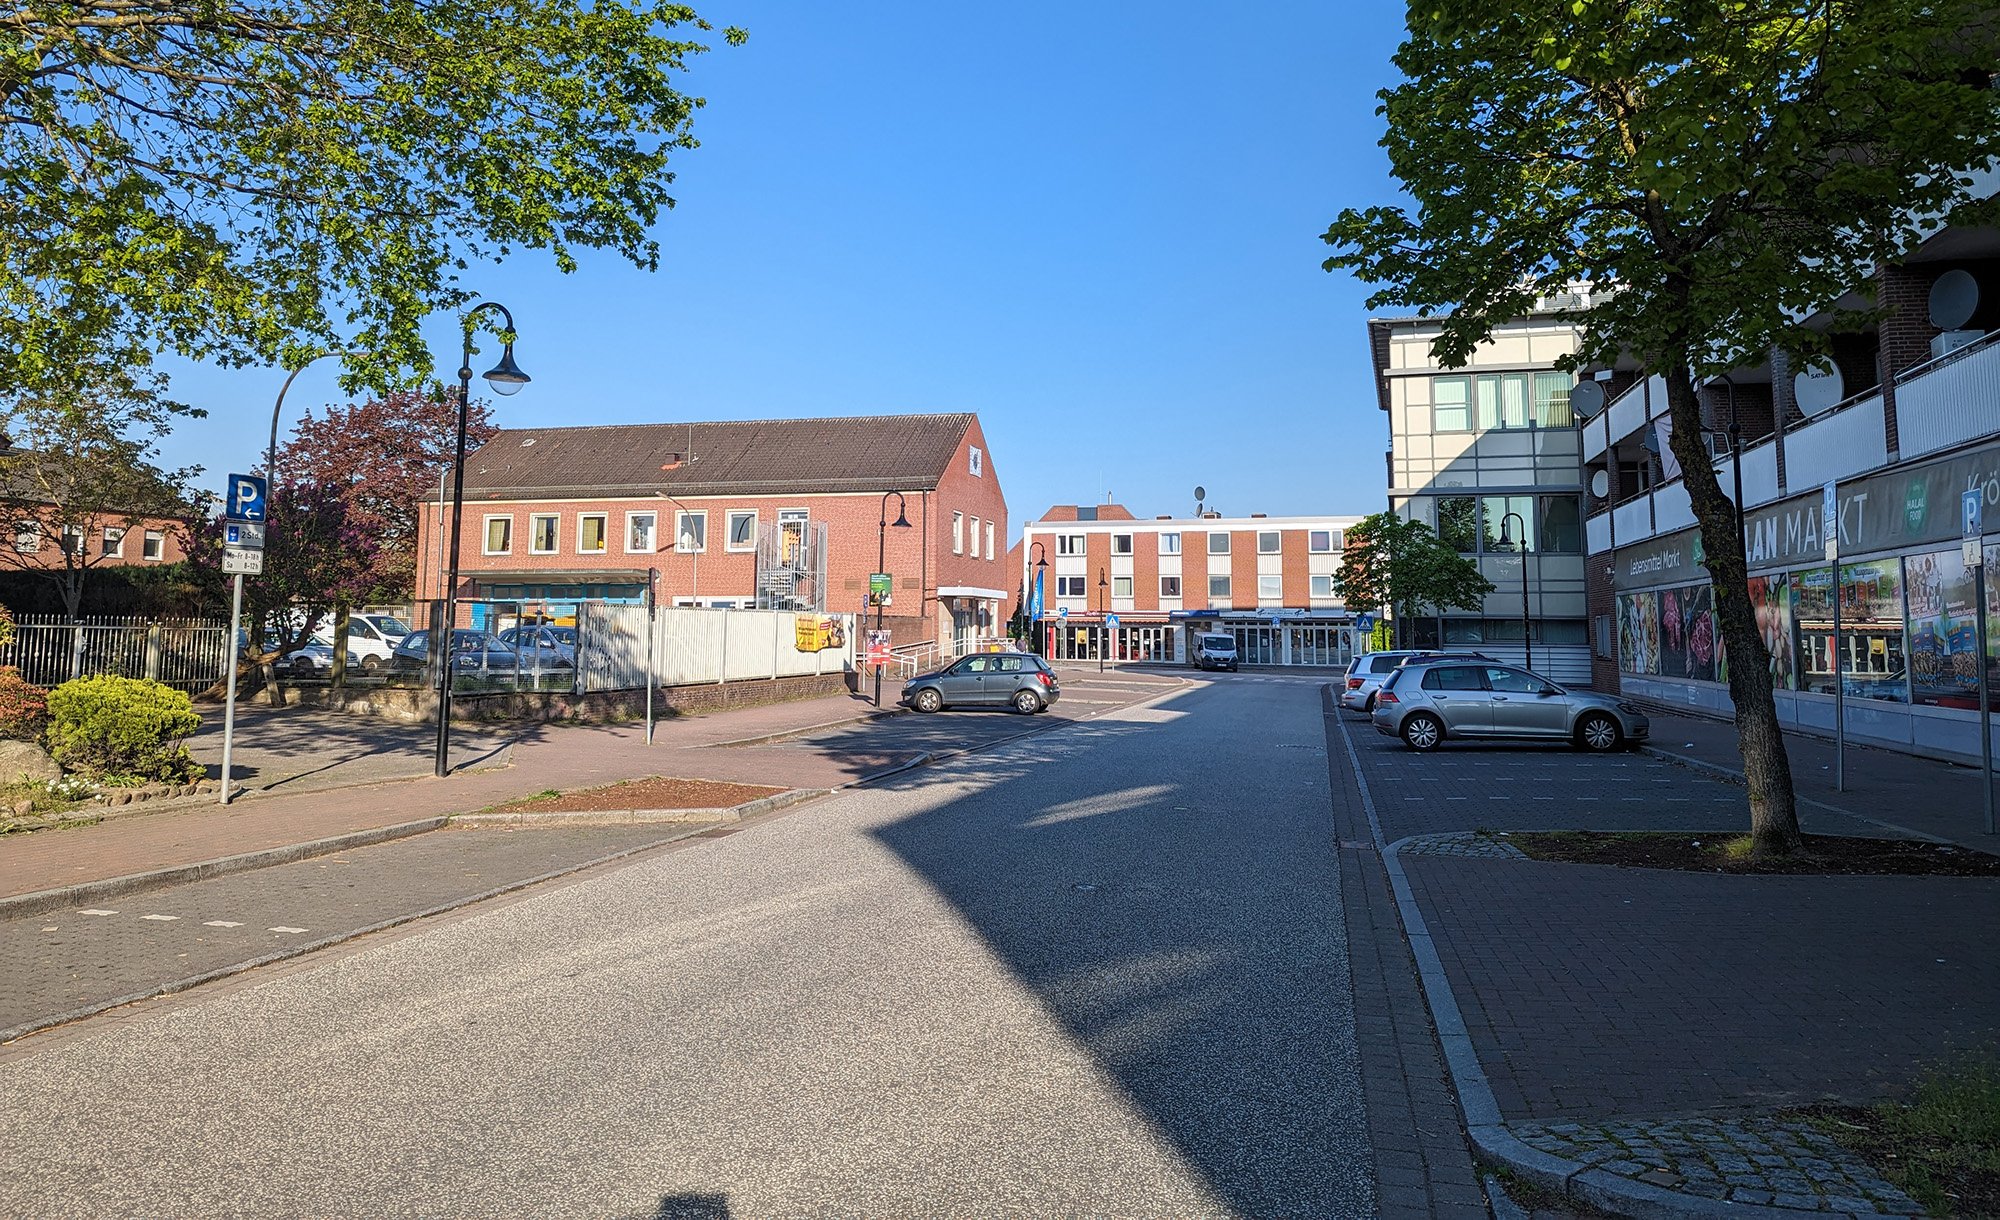
What if you could see the future of your city, not through sterile blueprints and complex diagrams, but through vivid, photorealistic images? As urban planners (well, that’s my university degree anyway) we always had the challenge of effectively communicating our ideas to the public. But the advent of AI-supported image generators, like Adobe Photoshop's latest generative fill feature, may just have revolutionized the process.
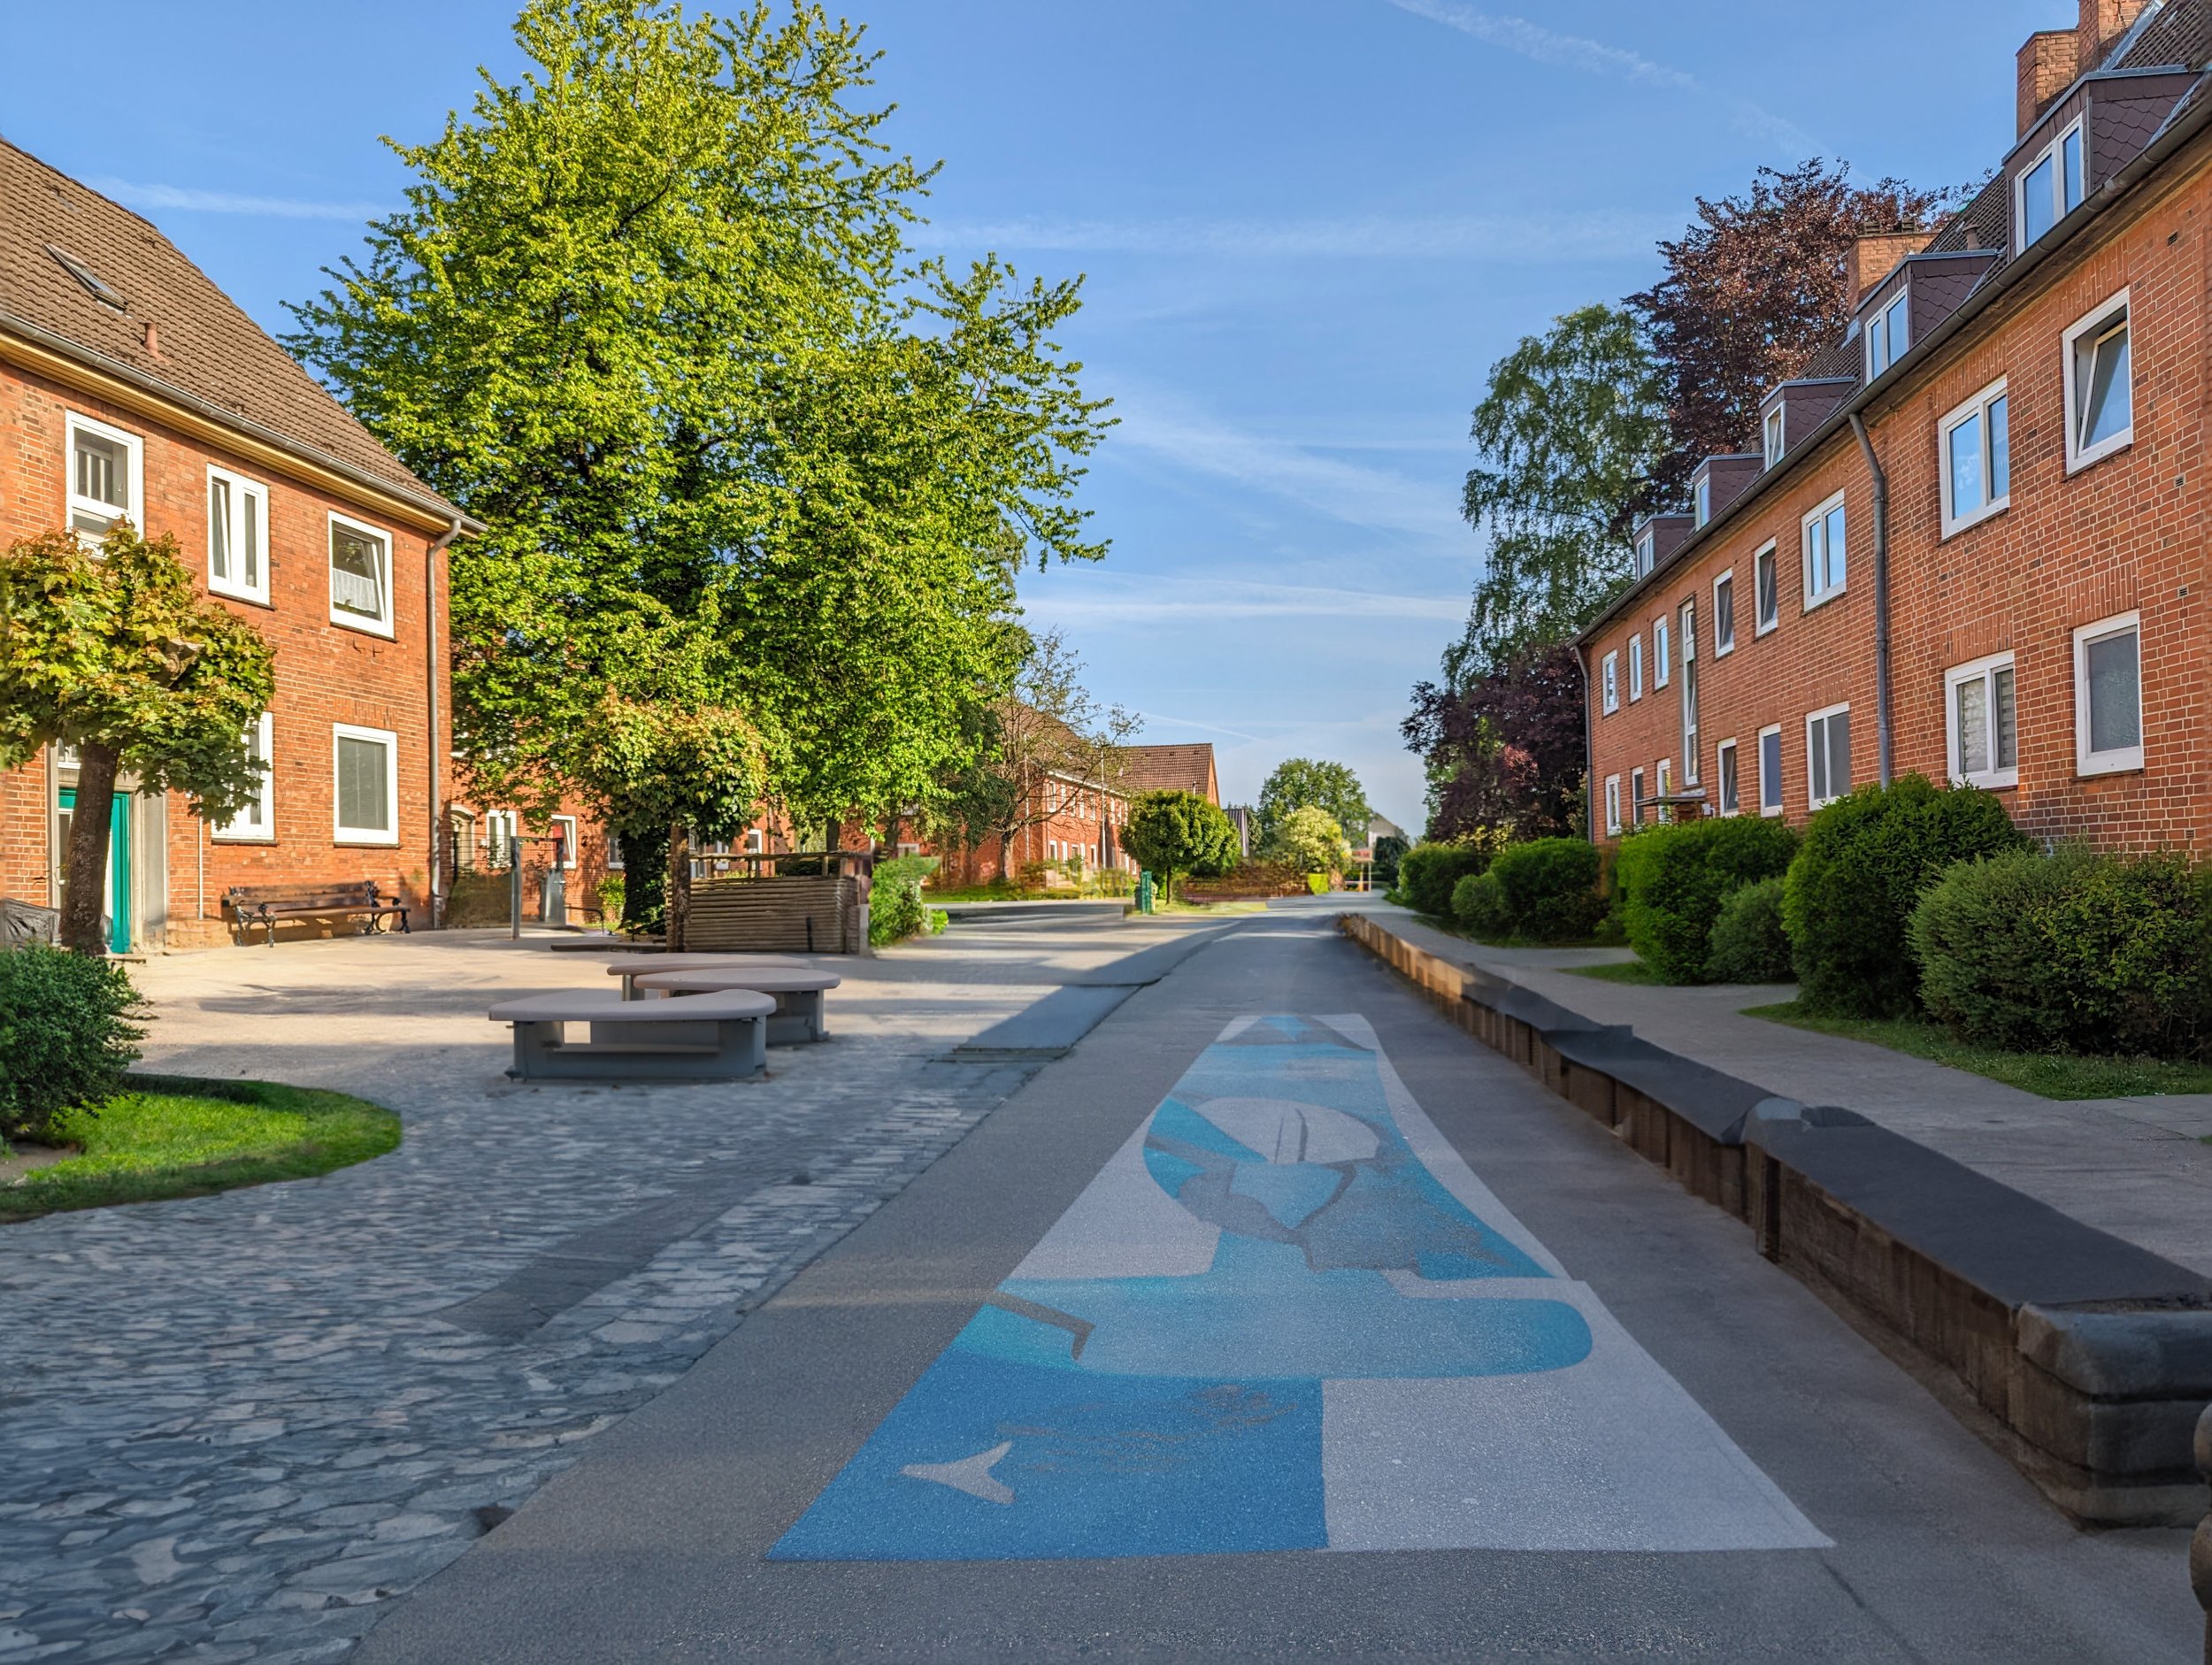
The new generative fill feature in Adobe Photoshop uses AI to generate realistic, detailed, and context-appropriate infills based on a given textual description. Imagine typing "park with a children's playground, bike path, and picnic tables," and then watching as the software generates a lifelike image of just such a park. This technology has the potential to radically change the way we design our cities and communicate these plans to citizens. It's a shift from abstract, hard-to-interpret plans to dynamic, relatable, and tangible visualizations.
This new tool brings public participation to the forefront of urban design, allowing citizens to visualize proposed changes in a much more intuitive and engaging way. The generative fill feature takes the conversation about urban development out of the realm of jargon-filled technical drawings and into a space where everyone can understand and contribute. This will inevitably lead to more informed discussions, more robust feedback, and ultimately, better designs that resonate with the people who will be using these spaces. Urban planners could even make this an interactive part of public hearings.
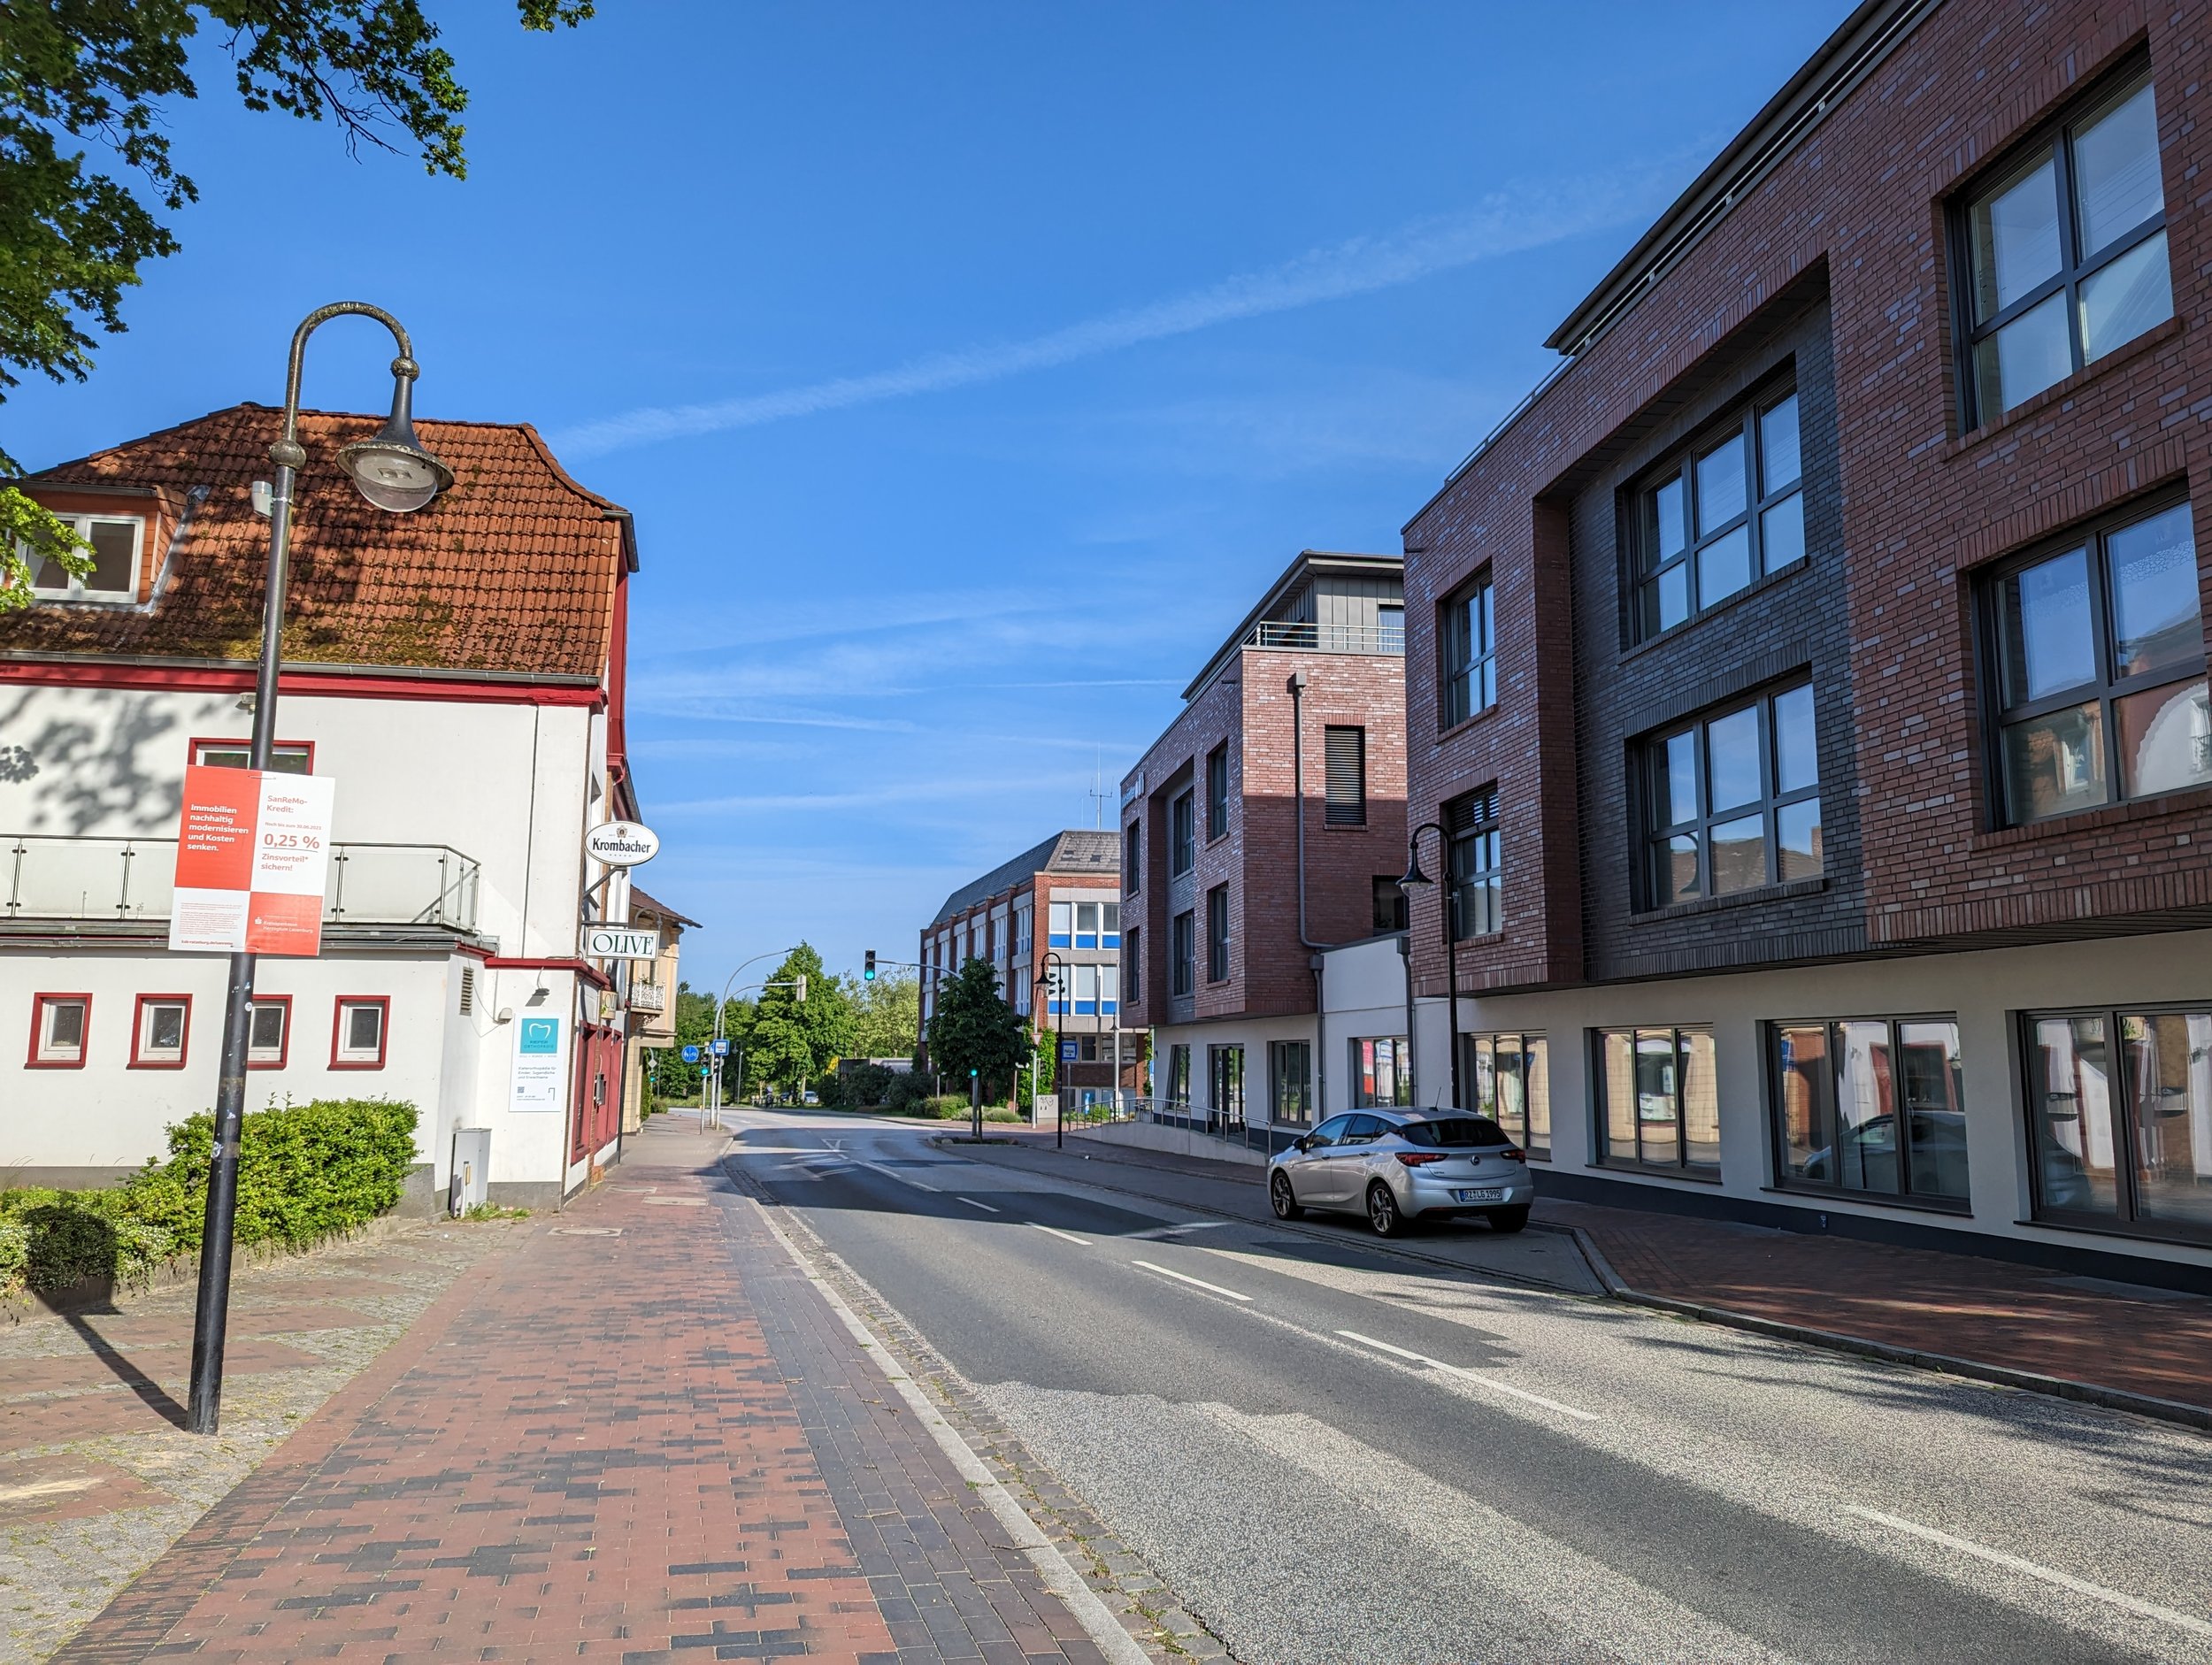
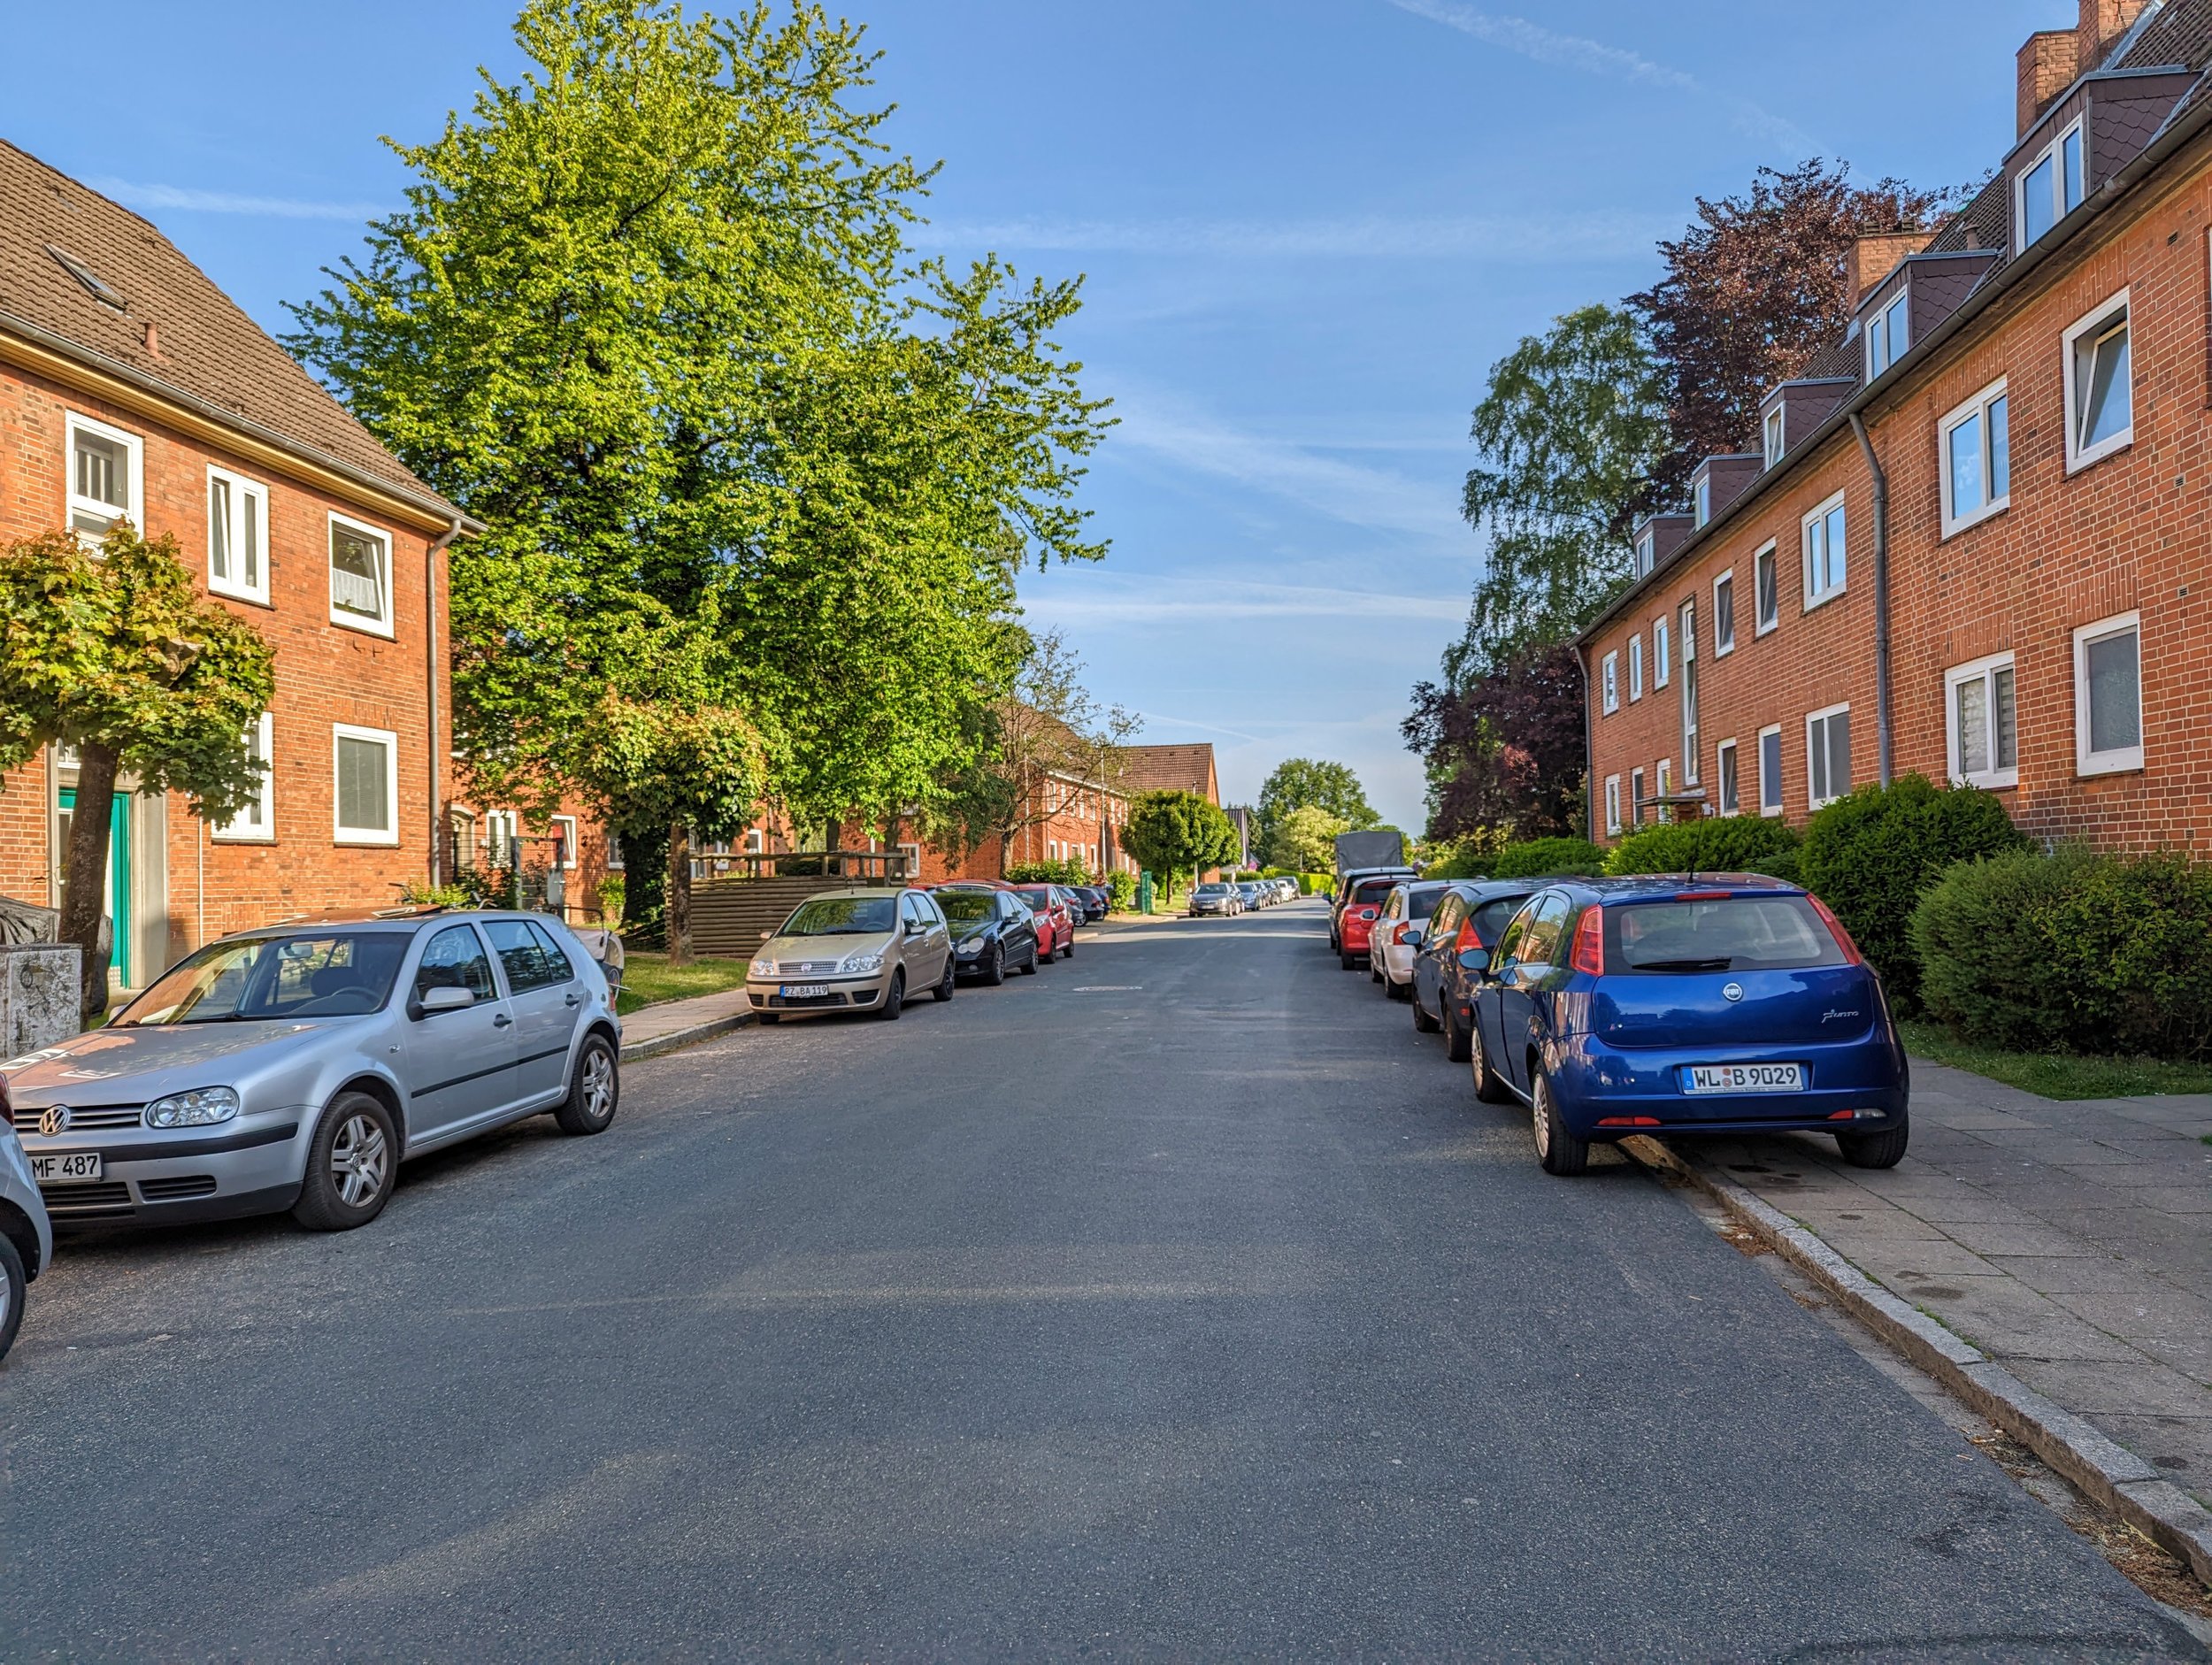
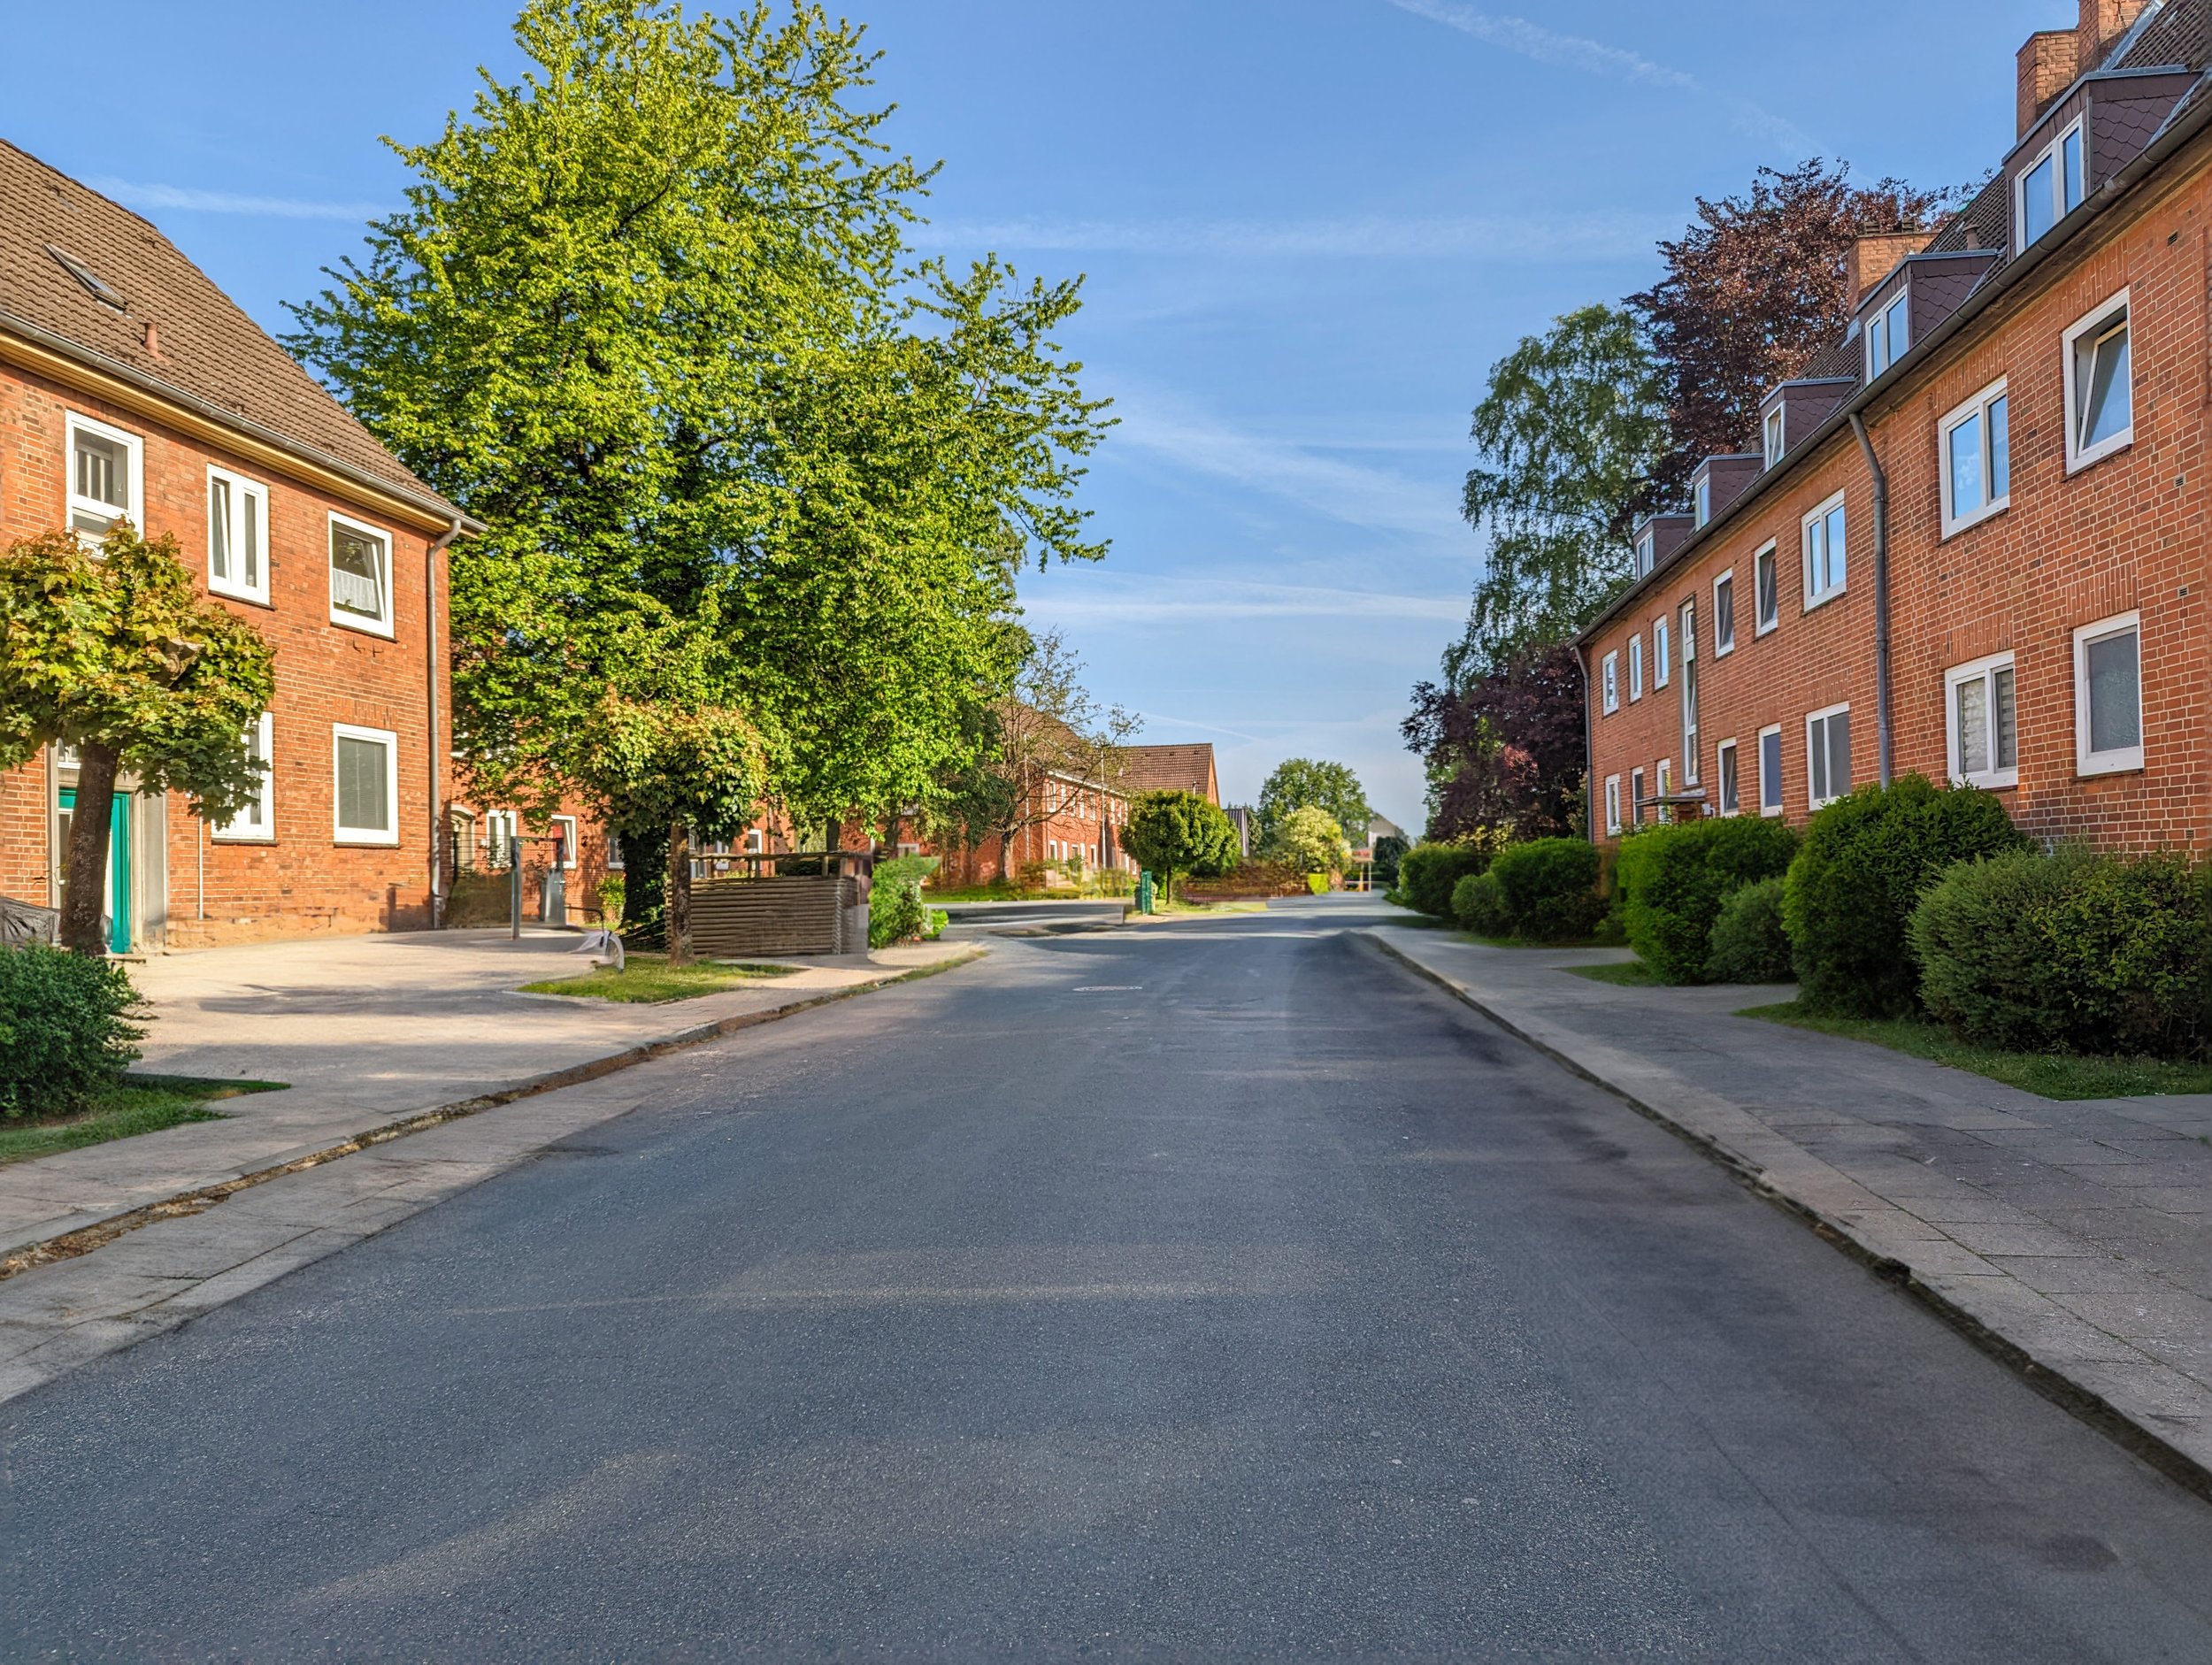
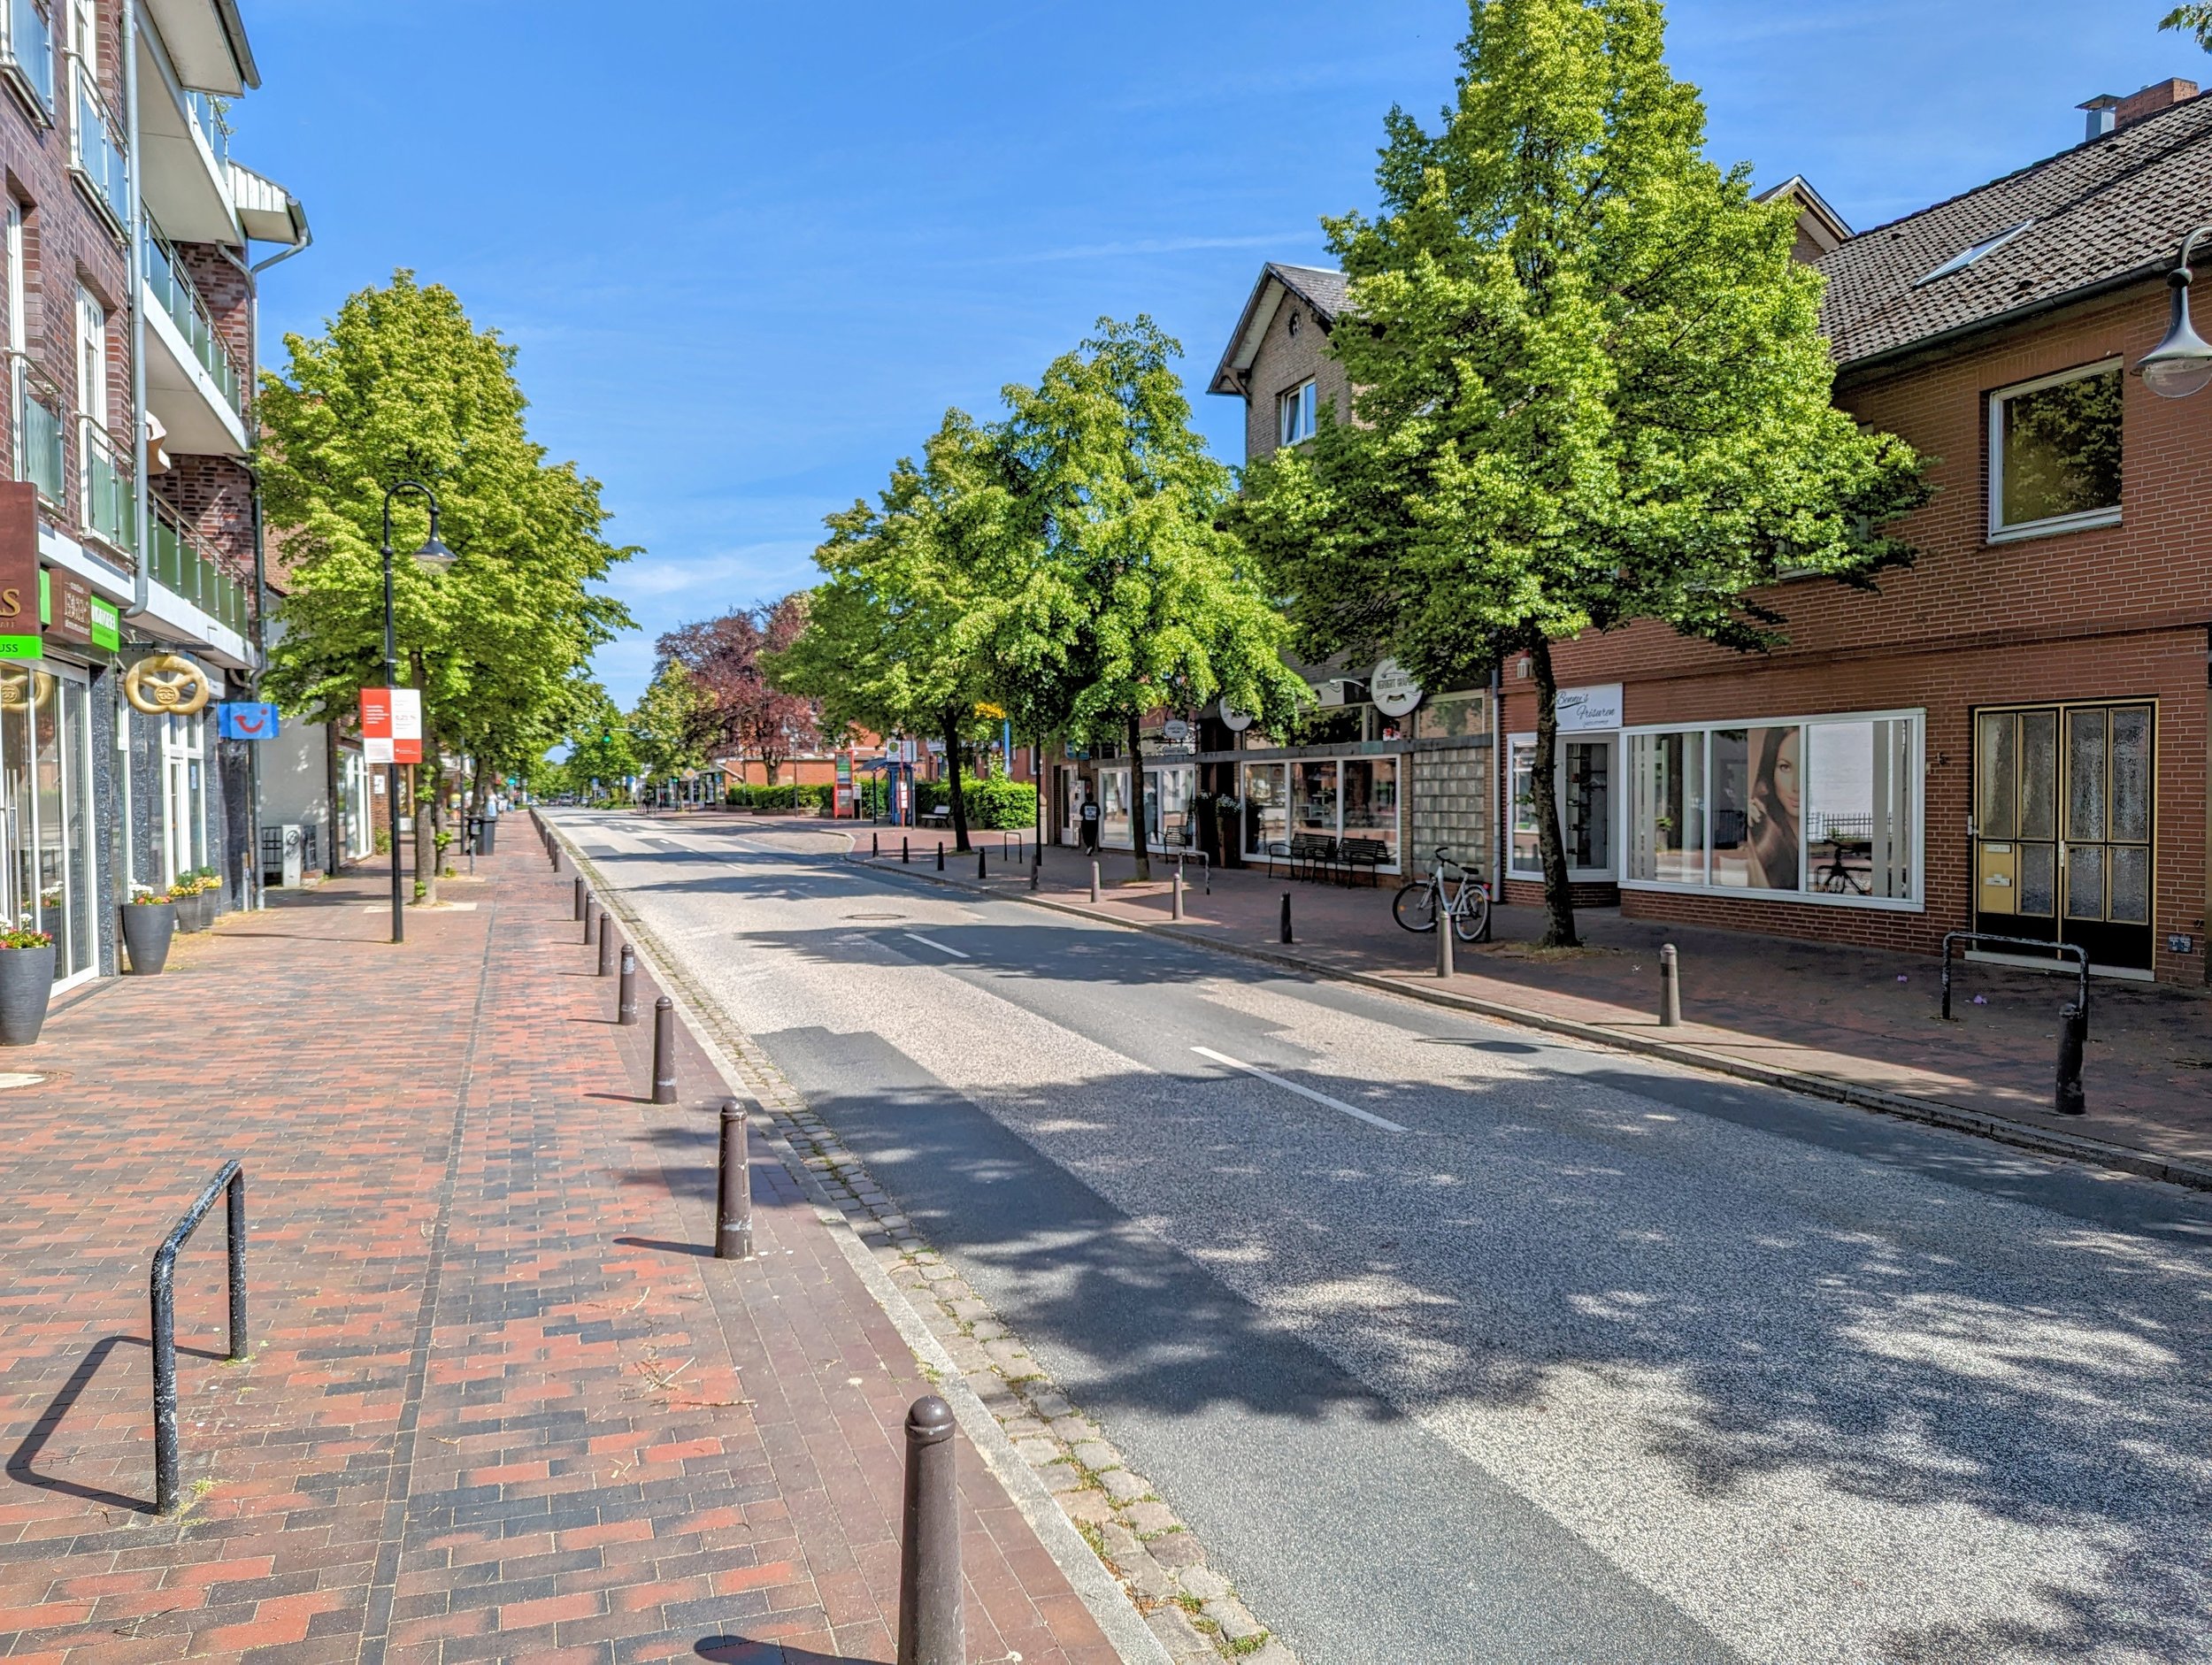
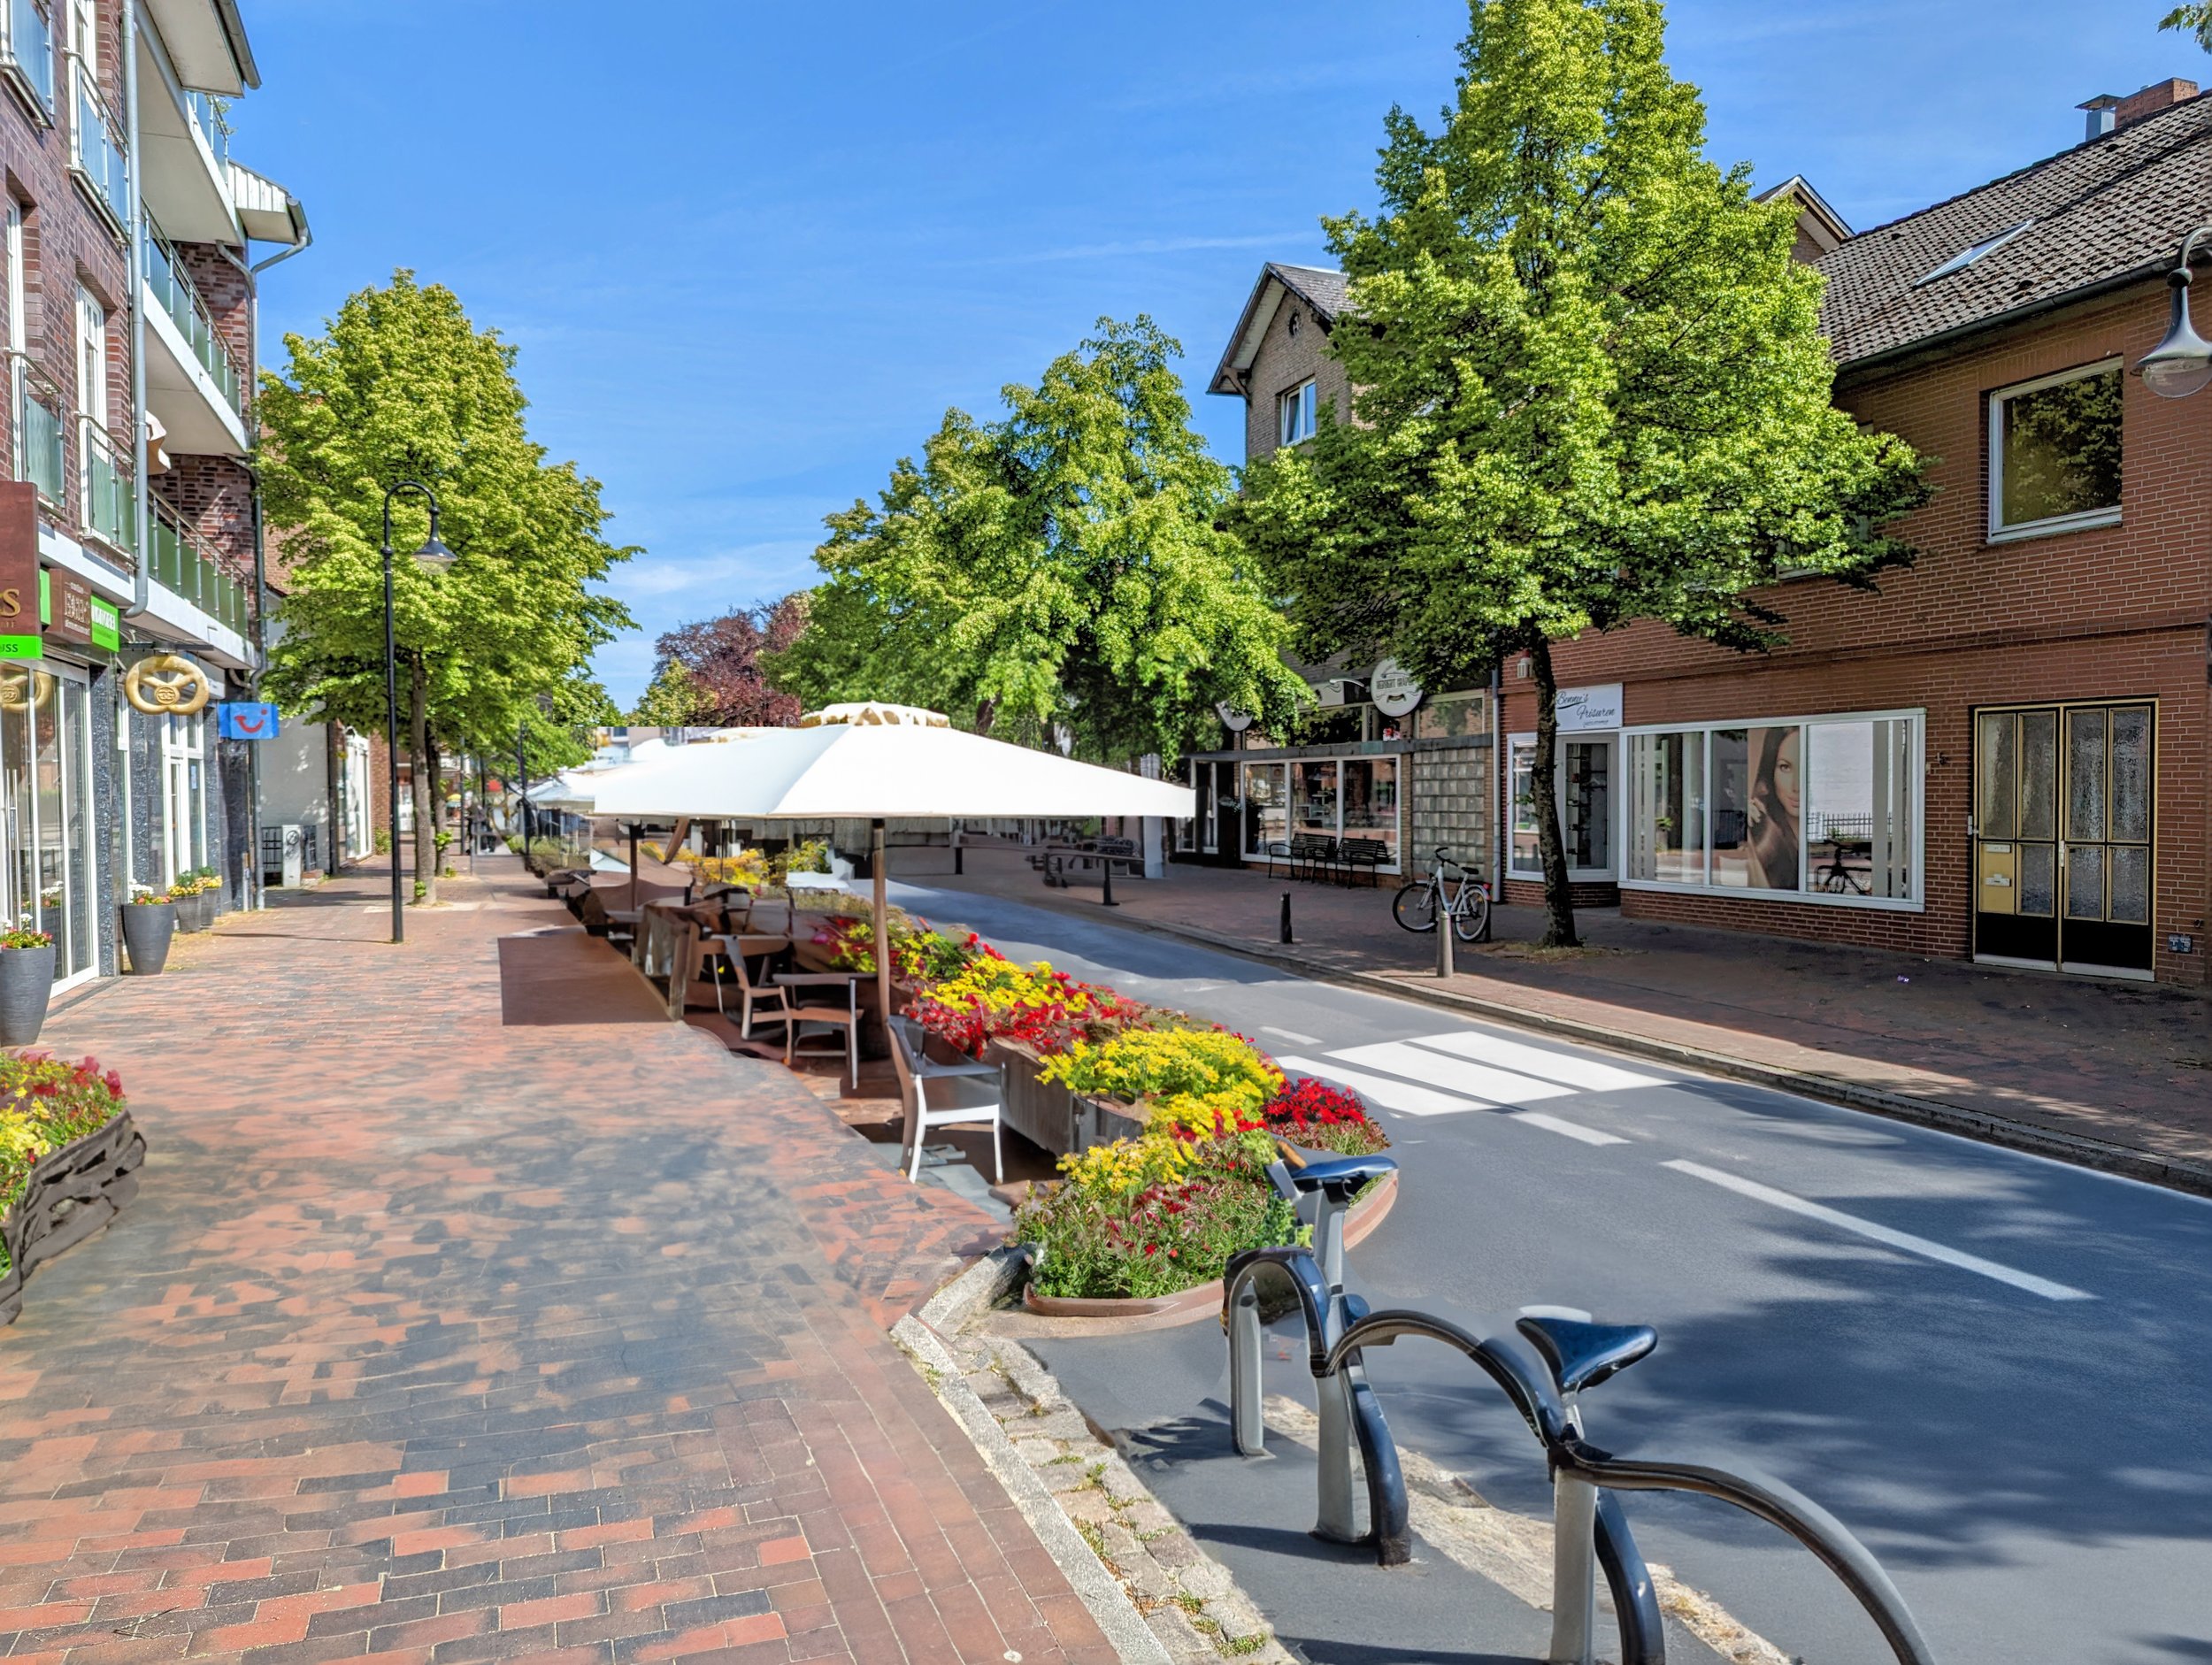
Recently, I had the chance to experiment with this feature using images from my hometown in Northern Germany. I was able to reimagine our town center into something much more livable — all in just about 20 minutes per image.
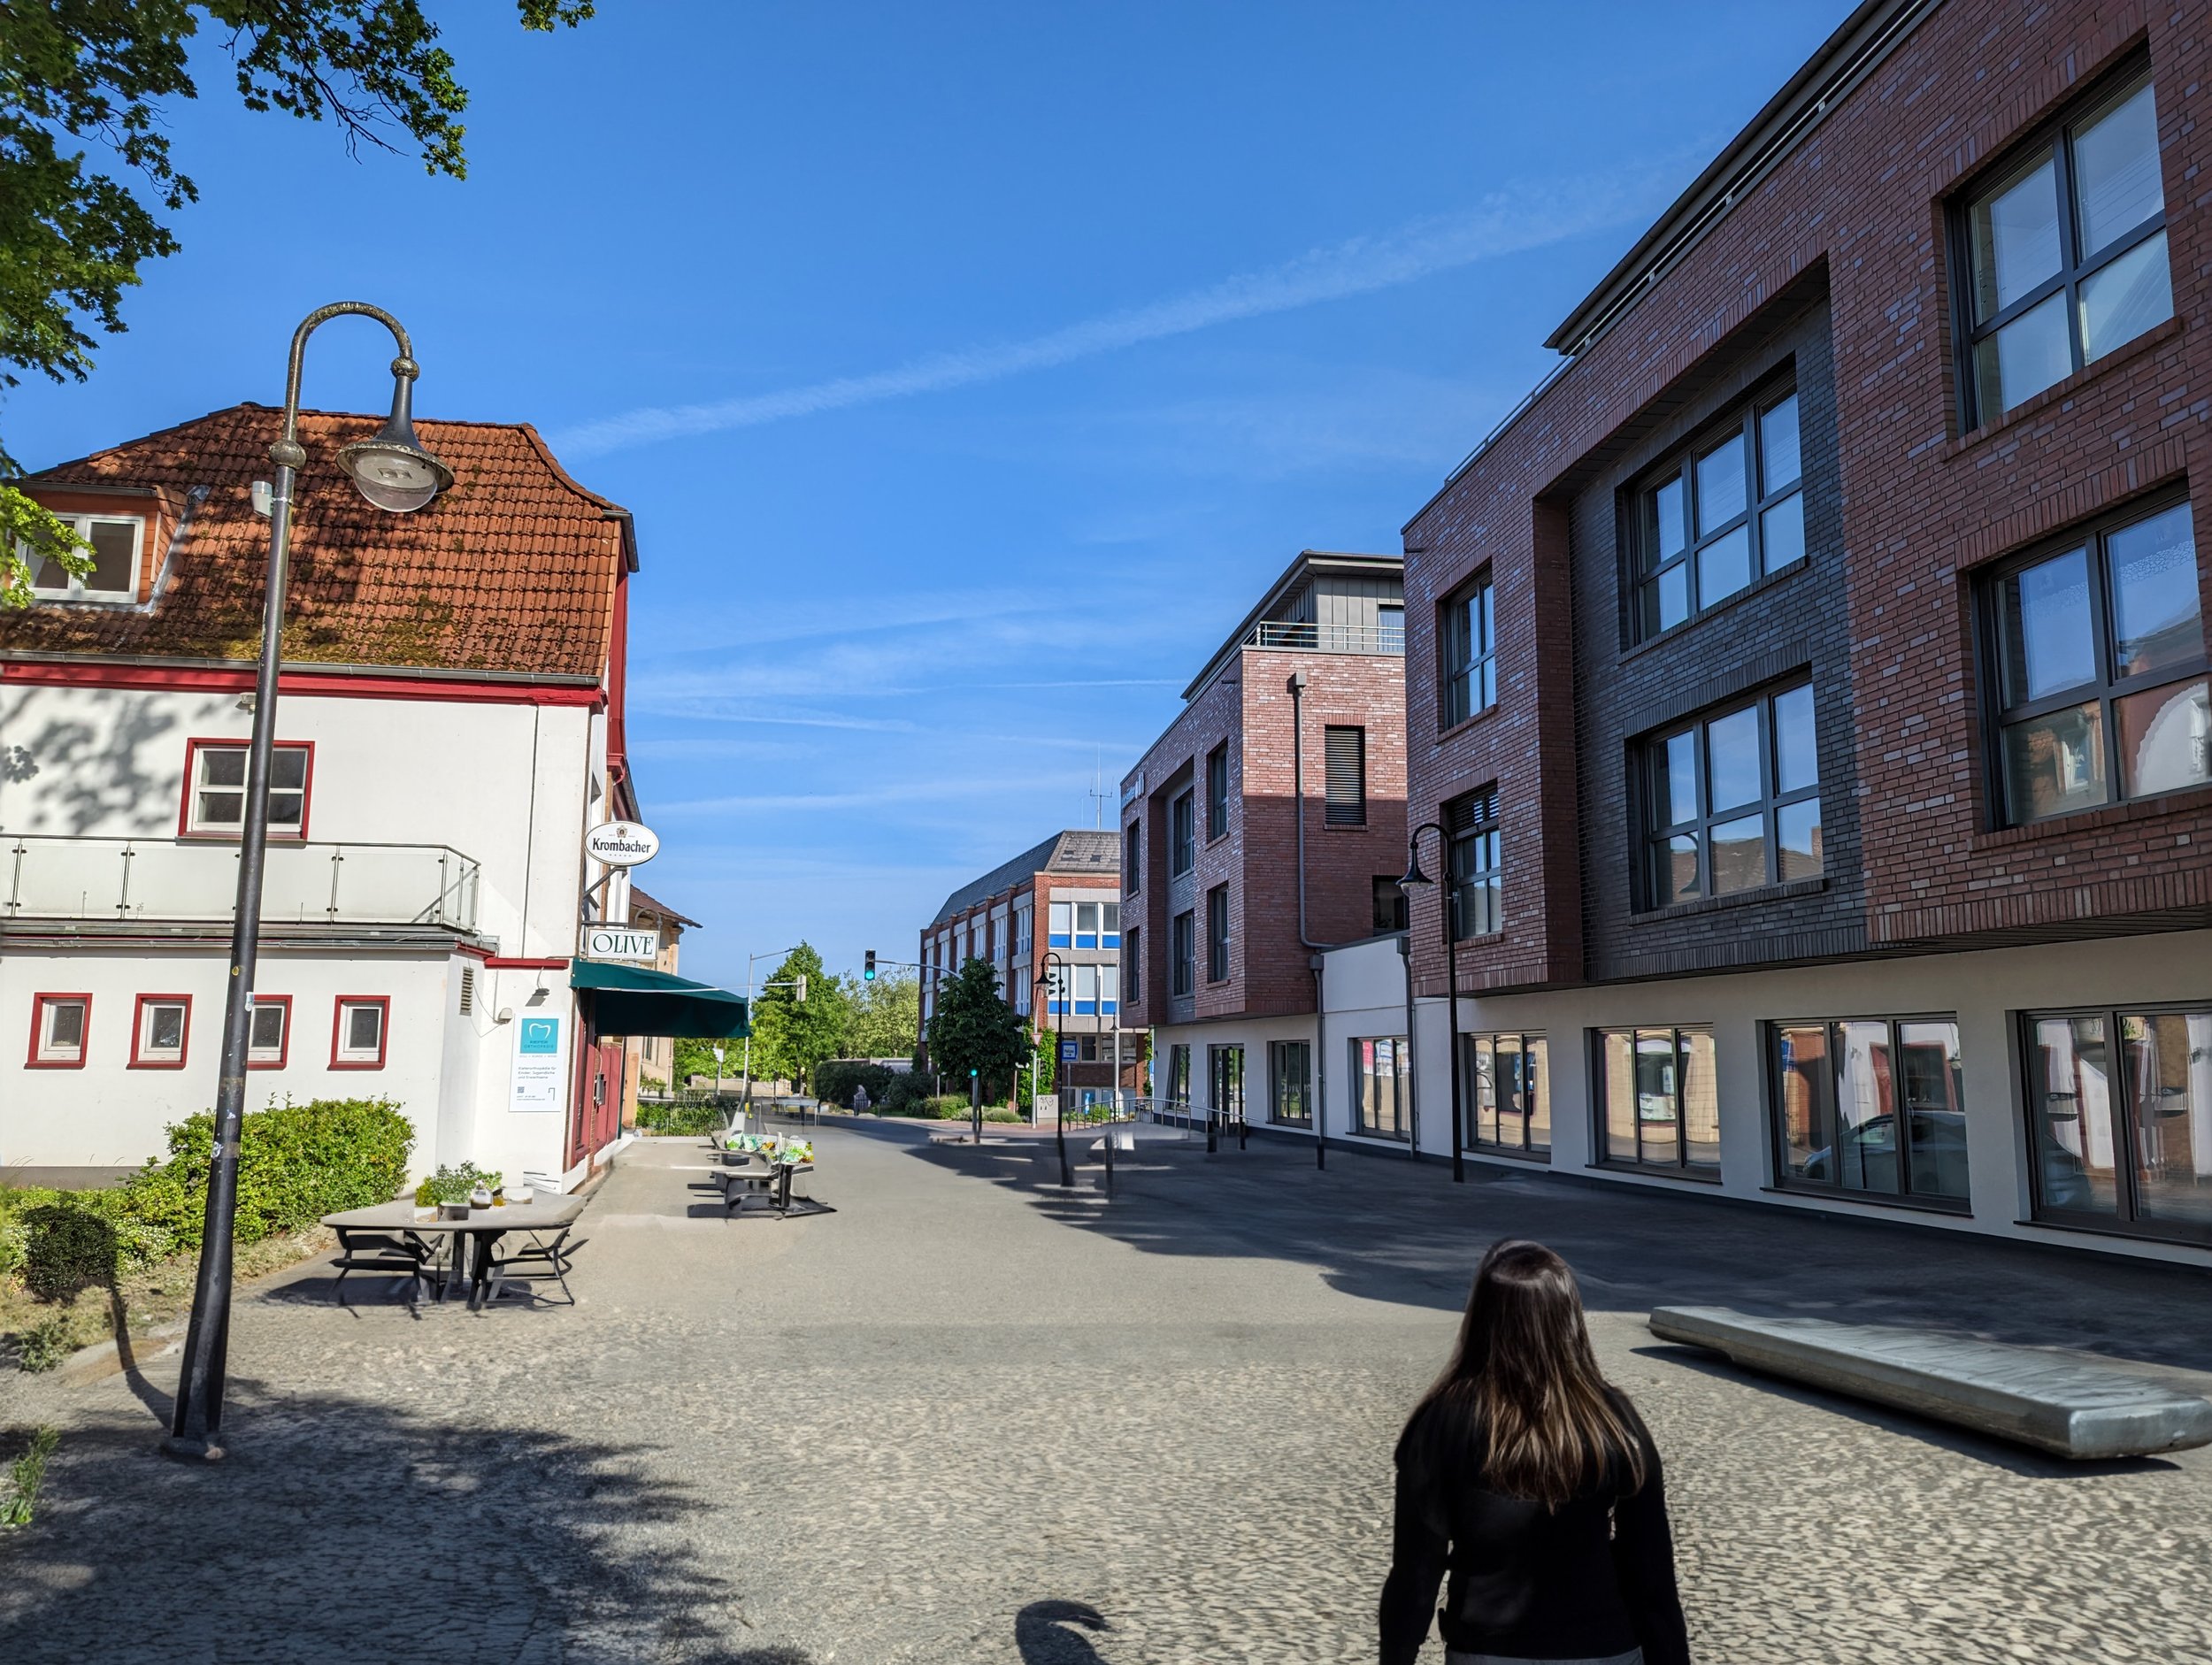
The results were astounding. Not only did the AI create images that were photorealistic-ish, but it also adapted perfectly to the surrounding environment, respecting the architectural style of the buildings, the quality of the light, the scale, and the overall context.
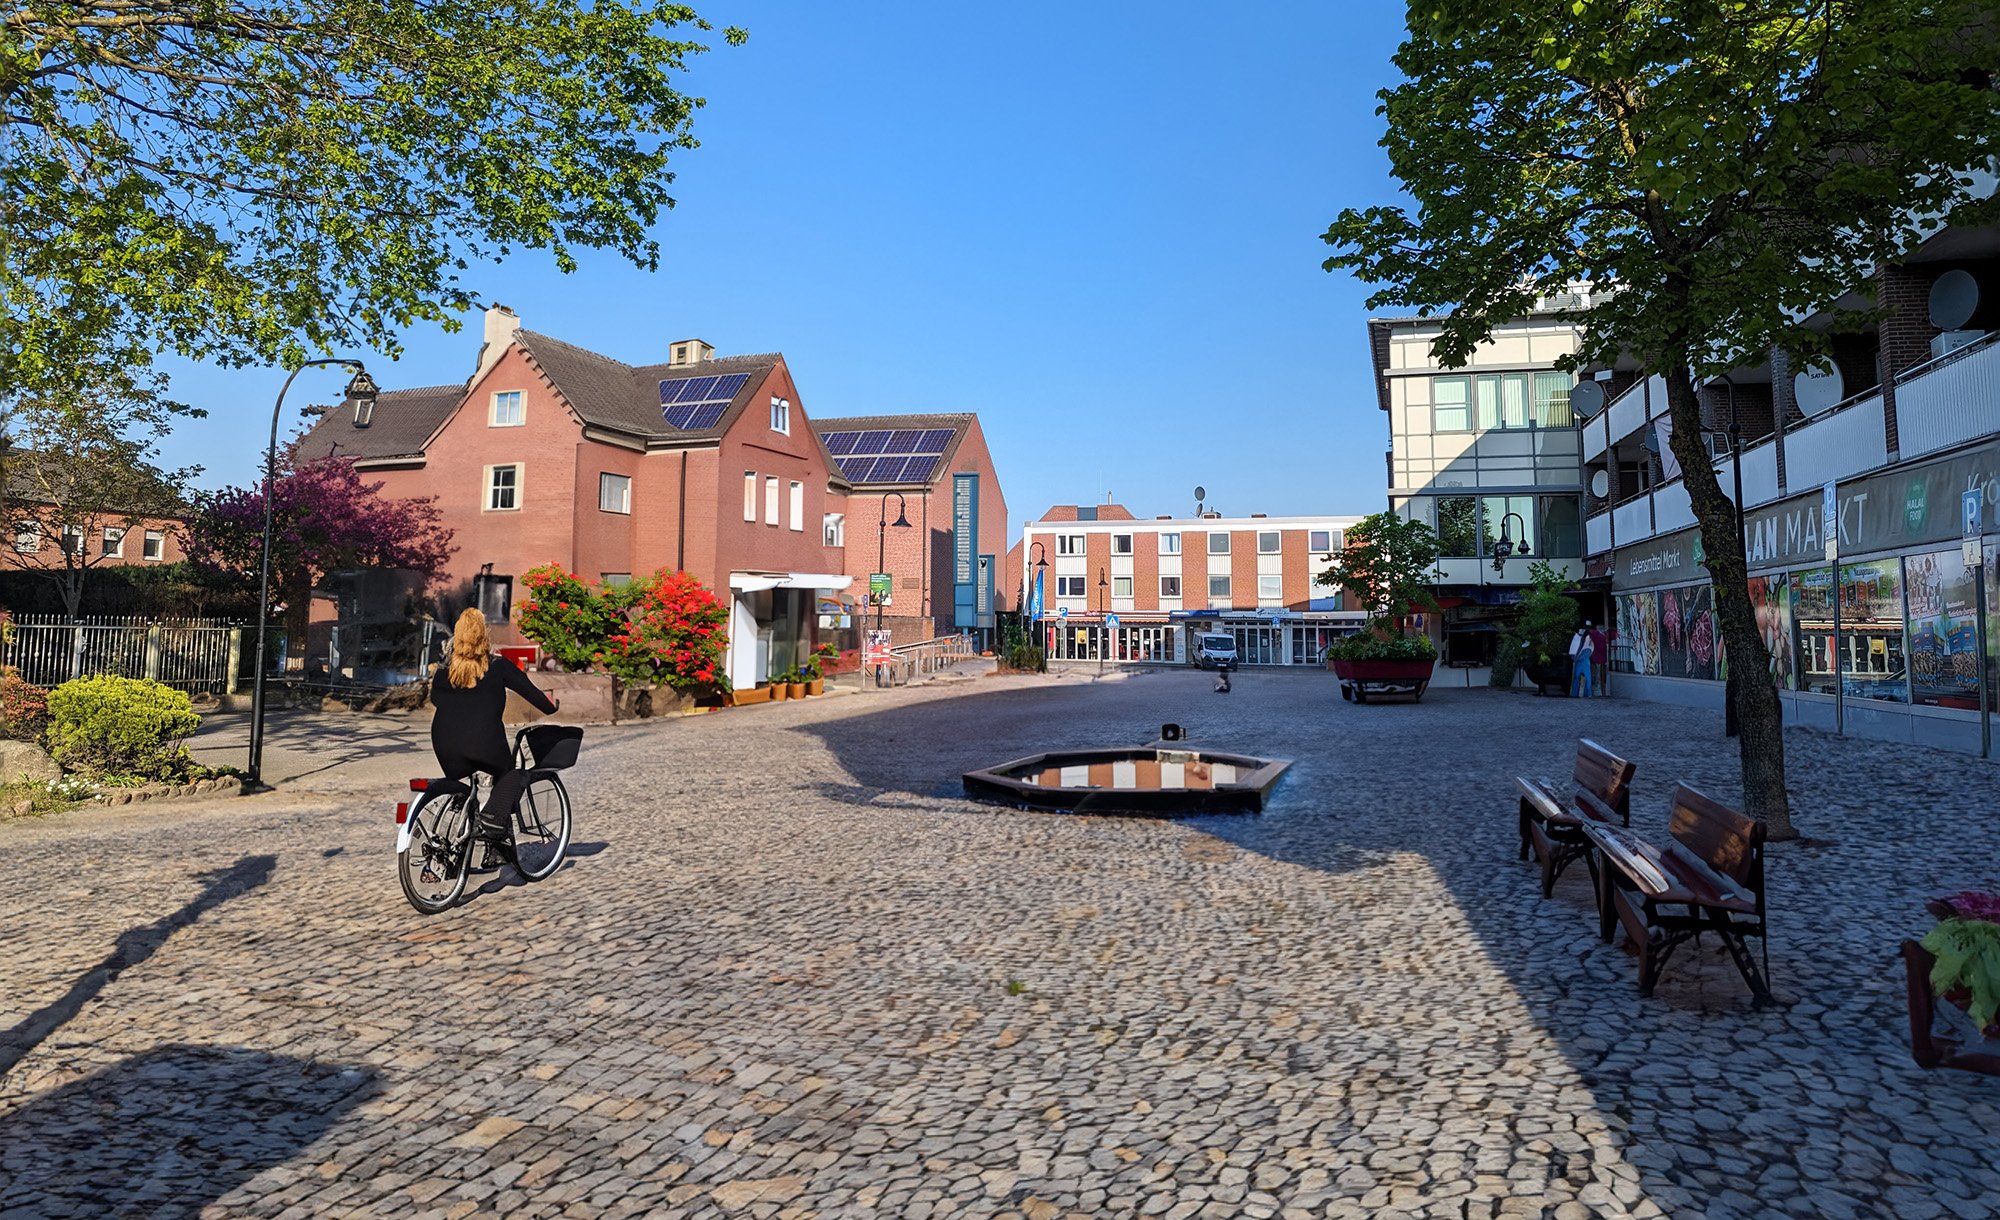
The potential for this technology in urban planning is immense. It provides a quicker, cheaper, and more approachable alternative to traditional 3D visualizations. It allows us to trial and experiment with different designs, to visualize the impact of potential changes before they happen, and to involve the public in the process in an unprecedented way.
The Adobe Photoshop generative fill feature is not just a new tool in architects’s or urban planners toolboxes. It’s a potential game changer, promising to make their work more inclusive, more accessible, and more impactful.
Writing ChatGPT prompts with Prompt-O-Matic
Have you ever found yourself drowning in a sea of repetitive tasks when trying to create prompts for AI tools like ChatGPT? If so, you're not alone. That's precisely why I decided to create (with a little help from ChatGPT) the PROMPT-O-MATIC - a nifty tool designed to make your life easier and more efficient when working with AI language models.

A Sneak Peek Into PROMPT-O-MATIC
Picture this: you're trying to create prompts for ChatGPT, and you're faced with an endless list of parameters to choose from. It's overwhelming, right? That's where PROMPT-O-MATIC comes in. This easy-to-use tool streamlines the whole process by offering drop-down lists for selecting parameters like:
Type of Text (Blog Post, Article, Email, etc.)
Style (Conversational, Formal, Creative, etc.)
Tone (Informative, Friendly, Professional, etc.)
Length (Short, Medium, Long)
Language (English, Spanish, French, etc.)
Format (Markdown, HTML, Plain Text)
What's more, you can tailor these parameters to your heart's content by editing the prompts.json file
Wrapping It Up
So, there you have it - your introduction to PROMPT-O-MATIC, the tool that's here to help your experience with AI tools like ChatGPT. Say goodbye to tedious prompt creation and hello to a more efficient, enjoyable way of working with AI language models.
Try it here: https://achimtack.github.io/PROMPT-O-MATIC/
100 Weeks
100 weeks ago today, I drew a "1" in a circle, and put a red line next to it. I have added another 699 so far.
- home office lines, where I would normally have been sitting in the office with old and new colleagues
- weekend lines without meetings with friends and family
- vacation lines, which were nice but didn't really satisfy the wanderlust
- physical-presence-in-office lines, which feel very unusual and special by now
- but also 3 purple vaccination lines that give me hope that there will be a final line on the board someday.
When will I draw this final line under the pandemic? Who knows, maybe in a few weeks, maybe a few more?
There is still some space on the board, although fortunately only a little.
my means of travel
Since for well-known reasons larger trips are currently out of the question, I had a look at the modes of transportation I use to get around. Recently I described the change of my mobility patterns due to Corona in a comprehensive evaluation and thought it would be interesting to look back a few years.
In particular, I asked myself which means of transport I use and to what extent. In transport planning, the breakdown of the total volume of movement by individual modes of transport is known as the modal share (or modal split). Based on my Google location data, I calculated my personal modal split over the past few years. I have excluded air travel from the following graphs because I was specifically interested in my everyday mobility and long flights distort the picture too much.
modal share (by trips taken)
Of course, the data is not perfect and probably not all trips are really accurately represented. But it' s easy to see that I like to walk or take the bike and am also a rail commuter. In 2020 and 2021, the proportion of my trips made by bike increased significantly once again.
modal share (by km travelled)
The number of trips is interesting for my general preference of different means of transportation but more interesting for me was the analysis of the covered kilometers. Here it becomes clear once again that for longer distances and daily commuting apart from vacation trips by plane, the train is my main means of transport.
A small side project for a rainy Sunday afternoon in April 2021. What other evaluations would be interesting?
Drop me a mail if you like.