keep calm and stay home…
When I started recording my home office days on my whiteboard in March I wouldn't have expected to still be doing this in November. 2020 is definitely a year I will remember for a while…

I have updated my mobility data evaluation once again. It corresponds quite well with the general pandemic situation in Germany. Obviously I adhere to the official guidelines to significantly restrict mobility and thus also contacts. However, I started the current lockdown a little earlier than officially specified and started with my personal restrictions earlier in October.
Well, I still have free space on the whiteboard, so the pandemic will probably continue for a while…
Until then: Stay safe!
limited mobility
For a few months now, a certain pathogen has been keeping people around the world in suspense. Personally, for me this means working from the home office, which sometimes works more and sometimes less well. As a small side-project I took a look at how my daily travelled distances have developed since the lockdown in Germany began. I used data from the location history of my Android phone and analyzed it using PostGIS. The chart clearly shows how much my daily routine has changed from how it was before the crisis.
So: Stay healthy and keep your distance!
its / db mobility hackathon 2017
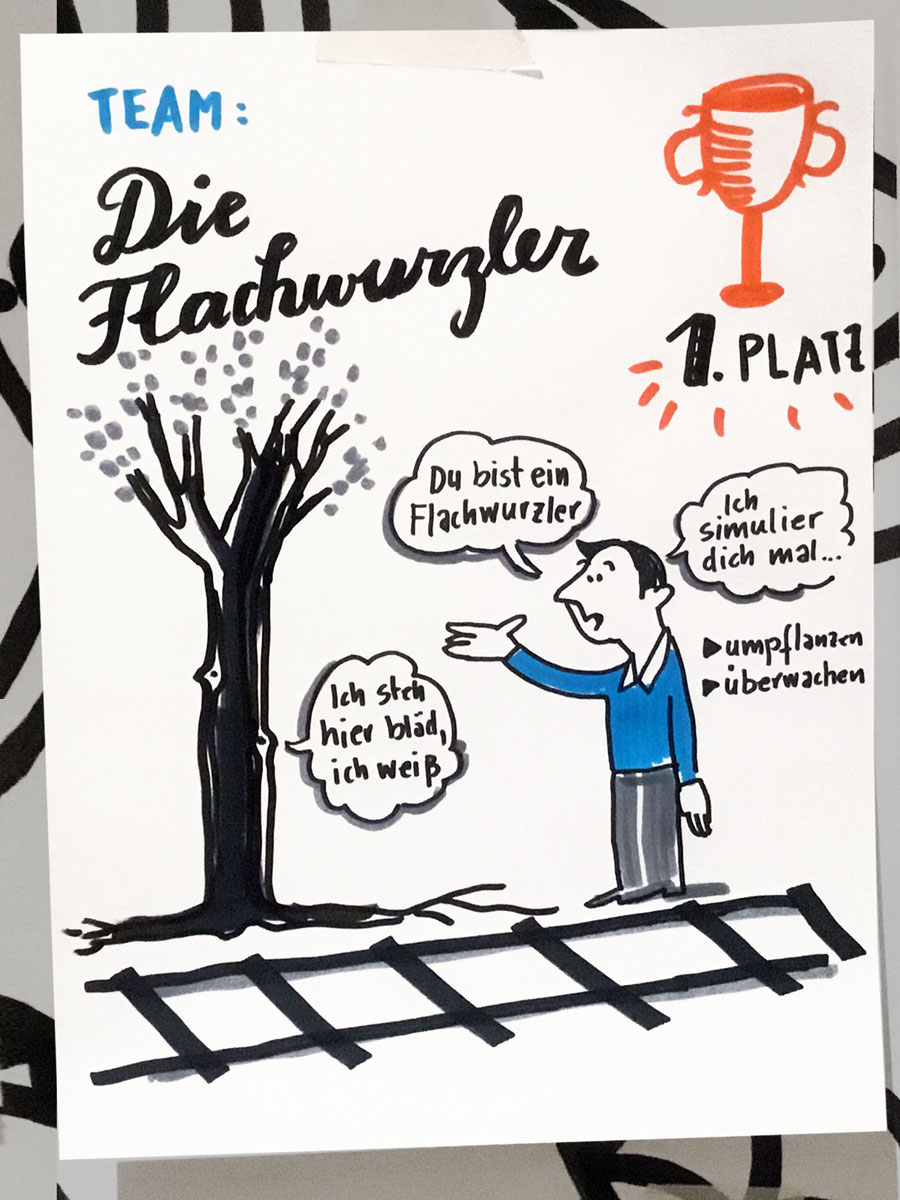
Our team consisting of four civity analyst took part in the DB / ITS Hackathon in Hamburg on Friday / Saturday and won the first place quite unexpectedly…
On a hackathon, a programming project / data analysis has to be developed from the idea to the prototype within 24 hours. We opted for the relatively current topic of “storm susceptibility of the rail infrastructure due to falling trees”. We used a combination of different methods and open datasets to create static and interactive maps to identify hot-spots within the German rail system in general and the Hamburg system in particular.
You can find the finished project here: http://46.101.153.57/
Pictures and further information can be found at: https://dbmindbox.com/db-opendata-hackathons/hackathons/hamburg/
drones are fun
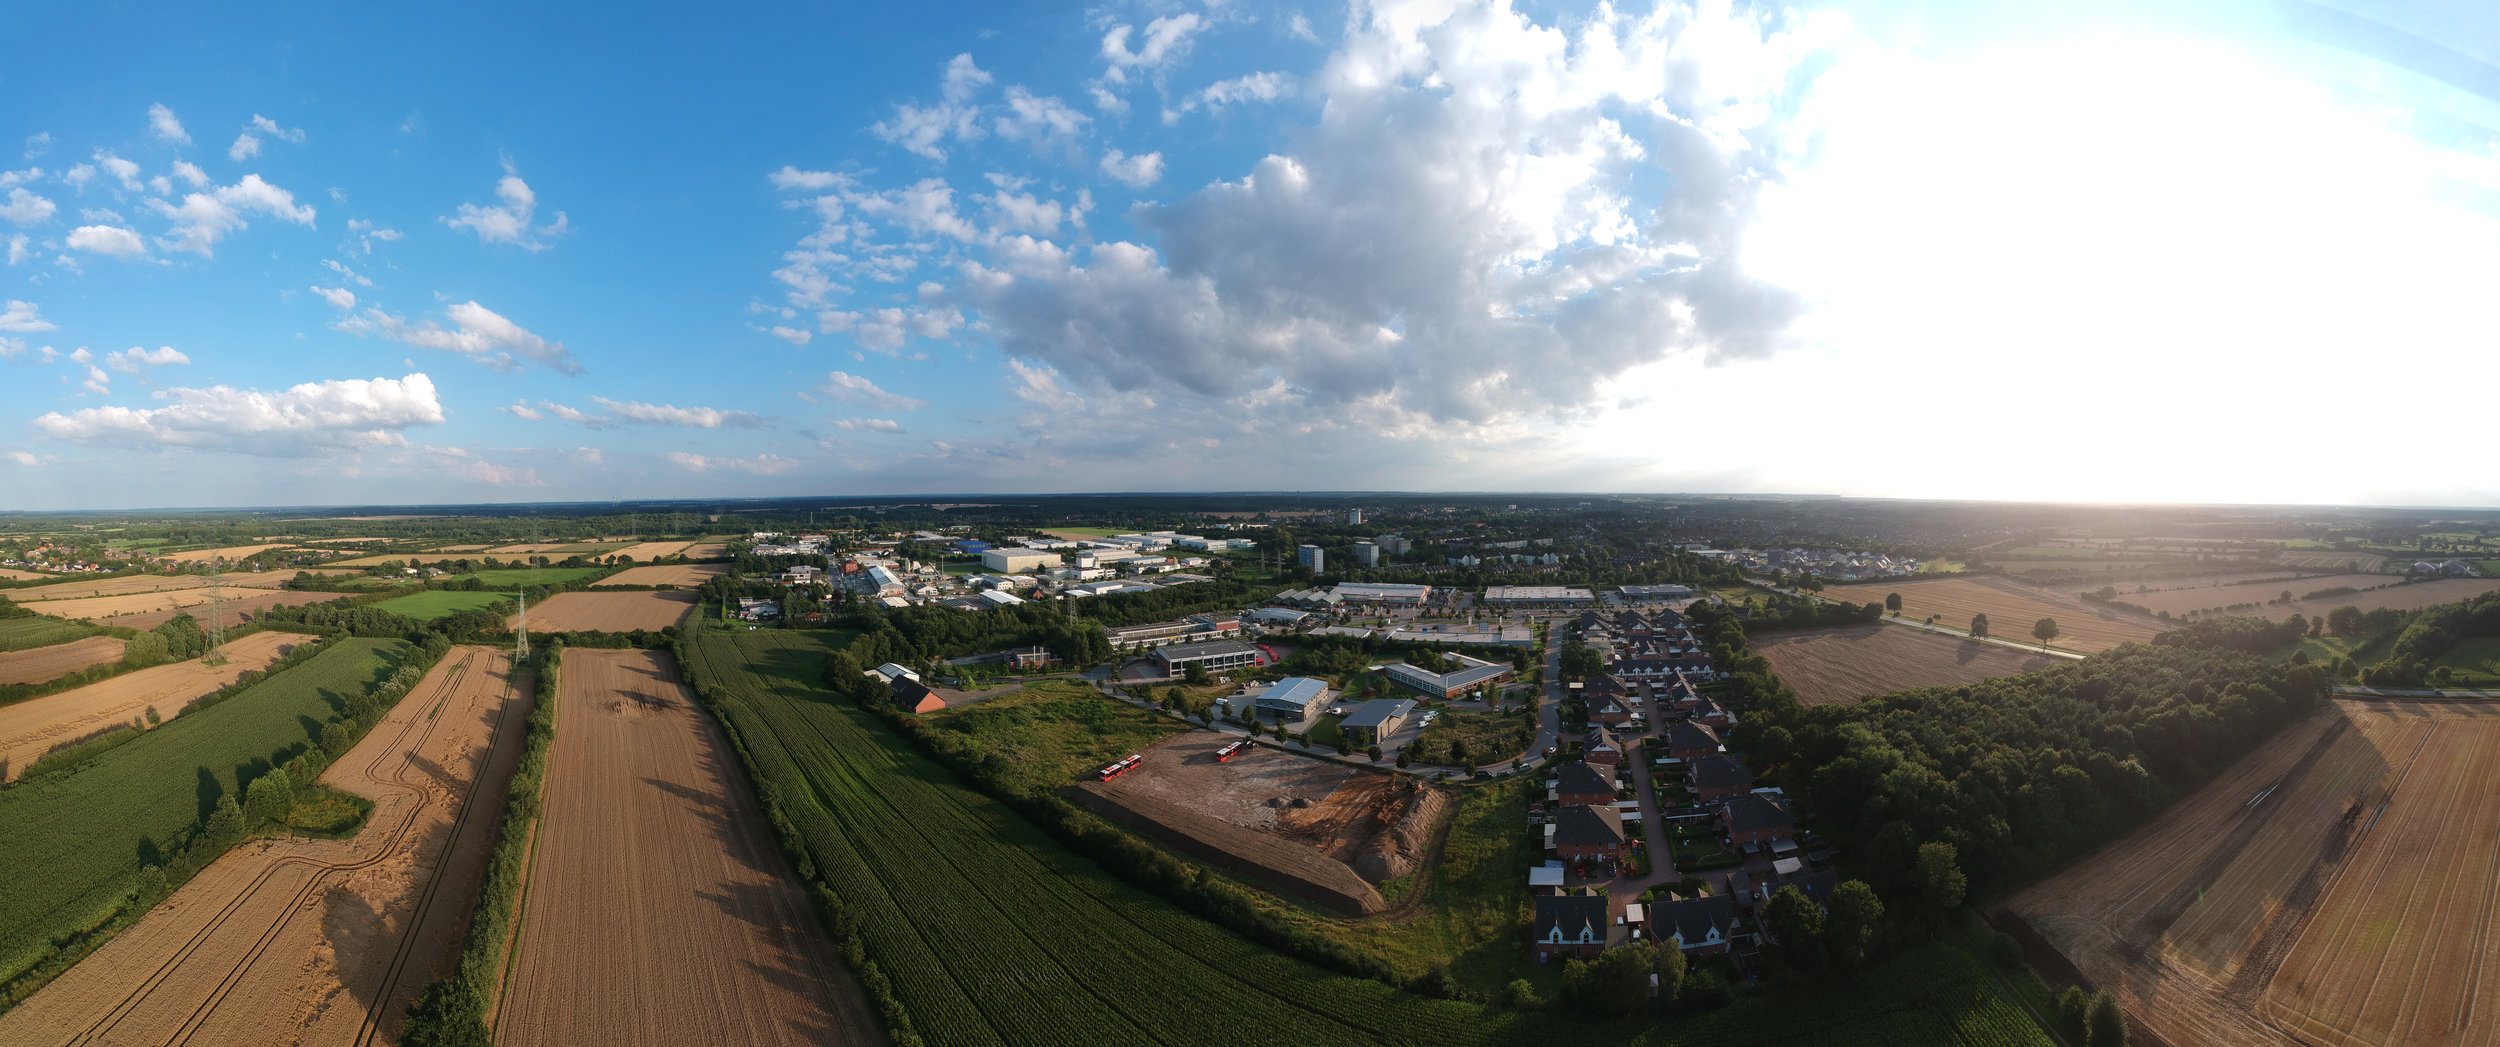
I just bought myself a dji spark (fly more combo). The stability, even in high winds, as well as the image quality is impressive.
so who's been polling whom?
The election of the German Bundestag takes place later this year and, of course, journalists and data-nerds are slowly beginning to think about data-driven stories. For this reason I have refurbished an old scraper of mine, which I wanted to use for quite some time. It scrapes meta information of state level election polls from the great website wahlrecht.de, which is the go-to place for polling data in Germany.
Using the scraper I aggregated data on 1885 individual polls beginning in 1999 and including state, release date, pollster and commissioning organisation. Obviously news organisations* concentrate on the polling results but I would like to focus on polling intensity and the question of who is conducting and paying for the polls. This is a little just for fun side-project with a pretty low level of detail.
Polling intensity by federal state
It is clear from the scraped dataset that Berlin has a much higher polling intesity than the other federal states. It is certainly worth pointing out that Berlin as a capital has a higher public interest than say the small city-state of Bremen. Still I consider it hardly remarkable that the intensity ranking does not exactly reflect the population ranking of the states: The data should be normalized against election individual years of the states.
Polling intensity over time
The polling intensity varies between 50 and 150 polls a year with a high in 2011 and a low in 2000 (Of course, the current year 2017 can not yet be fully counted). In 2011, a total of 7 state parliaments were newly elected, so that the peak can be well explained.
Top pollsters and commissioning organizations
Polls in Germany as a rule are conducted by four large pollsters, which in my sample account for a market share of about 72%. The value would be even higher if I had adjusted the data for the merger of Infratest and Dimap which are still included as two different institutions in the older part of the dataset.
Let us take a look at the commissioning organizations involved: Most of them are media outlets - both private and public service media. The strong presence of the Berliner Zeitung is striking, which commissioned a poll at Forsa nearly every month .
Pollster preferences by organisation
In the following table you will find the combinations of commissioning organization and pollster. It turns out that most organizations stick to a single pollster. Use the search mask and find out which media house uses which pollster.
So what?
Only few surprises emerged from this little project: Polls are increasingly being held before elections and most of the customers remain with a pollster. However, I find it interesting to see how many pollsters are in the market and who is commissioning them. There is certainly a "so what factor" to this analysis - but it was a nice project for a rainy sunday morning :)
* Disclaimer: I work part-time as a data journalist for Spiegel Online.